Micro Harmonic Swing Rhythm Meter + Structure PanelMicro Harmonic Swing Rhythm Meter
Overview
Inspired by the observation that markets often oscillate in recurring harmonic swings of both price and time.
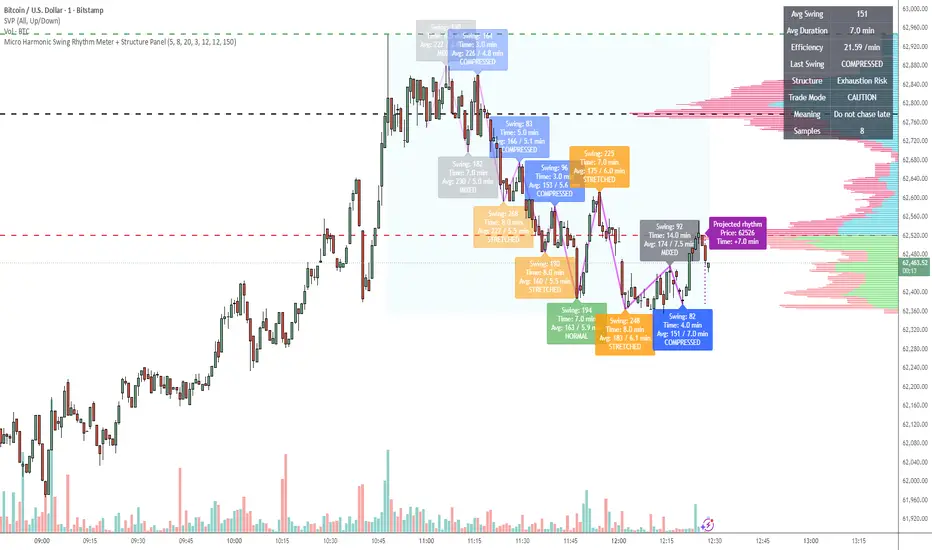
The Micro Harmonic Swing Rhythm Meter is a market structure and rhythm analysis tool designed to identify recurring swing behavior in price action.
Rather than focusing on traditional indicators such as momentum, trend, or overbought/oversold conditions, this indicator measures the repeating "heartbeat" of the market by tracking swing size, swing duration, and the evolving rhythm between successive price pivots.
The objective is not to predict price, but to monitor whether the current auction process remains stable, is compressing, expanding, or becoming exhausted.
Core Concepts
Every market exhibits recurring oscillations.
These oscillations often develop with similar:
* Price amplitude
* Swing duration
* Expansion and contraction cycles
The indicator automatically detects swing pivots and measures:
* Swing Size
* Swing Duration
* Average Swing Size
* Average Swing Duration
* Swing Efficiency
* Market Rhythm State
By comparing the current swing against recent averages, the indicator evaluates whether price action remains in harmony with its established rhythm.
Rhythm States
NORMAL
Current swing size and duration remain close to recent averages.
Interpretation:
* Stable auction
* Balanced market conditions
* Established rhythm remains intact
COMPRESSED
Current swing size and duration are smaller than average.
Interpretation:
* Energy accumulation
* Contracting auction
* Potential precursor to expansion
STRETCHED
Current swing size and duration exceed recent averages.
Interpretation:
* Expansion phase
* Strong directional movement
* Possible acceleration or exhaustion
MIXED
Price amplitude and swing duration are no longer synchronized.
Interpretation:
* Transitional market behavior
* Changing auction structure
* Reduced rhythm consistency
Market Structure Assessment
The indicator automatically classifies recent swing behavior into higher-order structure states.
Possible structure classifications include:
Balanced Rotation
Stable oscillatory conditions.
Trade Mode:
Range Mode
Compression / Coiling
Multiple compressed swings indicate energy accumulation.
Trade Mode:
Breakout Watch
Expansion Attempt
Expansion emerges following a period of compression.
Trade Mode:
Confirm Breakout
Exhaustion Risk
Repeated stretched swings suggest mature directional movement.
Trade Mode:
Caution
Unstable Auction
Excessive mixed swings indicate poor rhythm consistency.
Trade Mode:
Wait
Efficiency Metric
Efficiency is calculated as:
Average Swing Size ÷ Average Swing Duration
This metric measures how much distance price is covering per unit of time.
Rising efficiency often indicates increasing participation and directional conviction.
Falling efficiency often indicates slowing market activity and declining momentum.
Intended Usage
This indicator is designed primarily as a market state monitor rather than a signal generator.
It may be used alongside:
* Price action analysis
* Volume analysis
* Order flow tools
* VWAP frameworks
* Market profile
* Liquidity analysis
The indicator is particularly useful for identifying:
* Compression before expansion
* Changes in auction rhythm
* Developing directional impulses
* Potential exhaustion conditions
Recommended Workflow
Higher timeframes may be used to determine dominant market structure while lower timeframes are used for execution.
Example:
30-minute chart:
Market structure and session rhythm
5-minute chart:
Tactical structure
1-minute chart:
Execution and timing
This multi-timeframe approach allows traders to align lower timeframe opportunities with higher timeframe rhythm conditions.
Disclaimer
This indicator is designed to assist with market observation and structure analysis. It does not provide trading advice and should not be interpreted as a standalone buy or sell signal.
Индикатор

Индикатор

XABCD Formation Engine + PVM Confirm# XABCD Formation Engine + PVM Confirmation
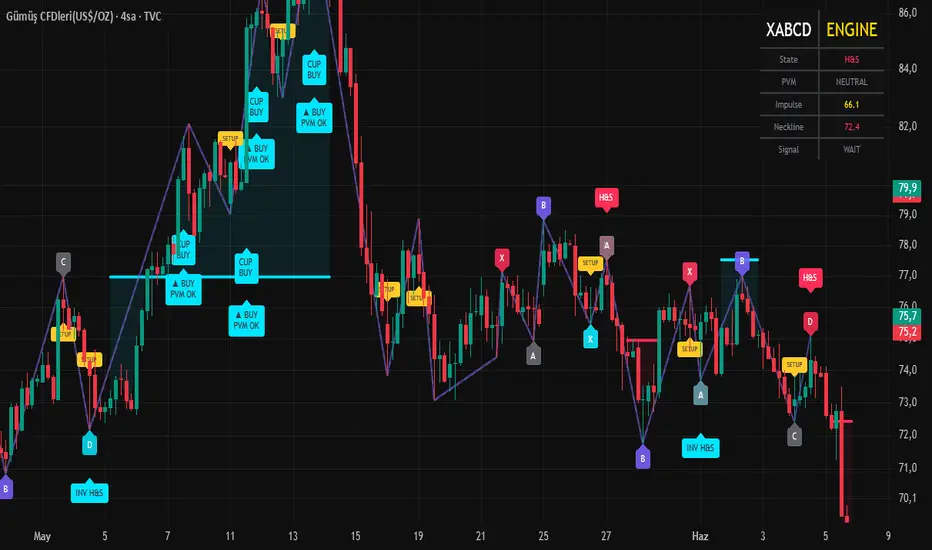
XABCD Formation Engine is a pattern recognition and confirmation framework designed to detect classical market structures and validate them with a proprietary Price-Volume Momentum (PVM) engine.
Unlike traditional pattern indicators that simply draw formations and trigger signals at breakout points, this system focuses on filtering weak structures and reducing false breakouts through volume, momentum, and trend confirmation.
## Supported Pattern Structures
The engine automatically monitors and validates:
• Head & Shoulders (H&S)
• Inverse Head & Shoulders (INV H&S)
• Cup
• Inverse Cup
• XABCD Swing Structures
The indicator continuously tracks X-A-B-C-D pivot development, allowing traders to identify formation progress before a breakout occurs.
## Preparation Stage
One of the unique features of this system is the Preparation (Setup) phase.
Before a complete pattern is confirmed, the engine identifies developing structures and displays preparation zones. This allows traders to monitor potential opportunities before the crowd notices the breakout.
Preparation labels do not represent entry signals. They indicate that a valid structure is forming and should be monitored.
## PVM Confirmation Engine
The core confirmation system is built around the proprietary PVM engine.
PVM combines two independent market components:
### Trend Engine
The Trend Engine measures the relationship between price movement and volume participation.
Healthy trends typically show price and volume moving together. When volume supports price expansion, trend quality increases.
This allows the engine to distinguish between:
• Genuine trend development
• Weak trend continuation
• Low-conviction breakouts
### Impulse Engine
The Impulse Engine measures:
ATR Expansion × Relative Volume
This component is specifically designed to detect the arrival of aggressive participation before a major breakout occurs.
The goal is to identify:
• Early momentum acceleration
• Institutional participation
• Emerging directional pressure
before most classical indicators react.
## False Breakout Filtering
One of the main objectives of this indicator is to reduce false pattern signals.
A breakout is not considered valid simply because price crosses a neckline or resistance level.
The system additionally evaluates:
• Trend quality
• Volume participation
• Momentum expansion
• Impulse strength
Only when these factors align does the confirmation engine approve the breakout.
This helps filter many low-quality formations that frequently fail after triggering.
## XABCD Visualization
The XABCD structure serves as the foundation of pattern construction.
Each pivot is labeled:
X → A → B → C → D
These points allow traders to visually inspect the internal geometry of the formation before confirmation occurs.
The XABCD sequence is not merely decorative. It provides insight into:
• Swing symmetry
• Shoulder balance
• Formation quality
• Structural integrity
## Color Interpretation
### Cyan Labels and Zones
Bullish structures and confirmations.
Used for:
• Inverse Head & Shoulders
• Bullish Cups
• Long confirmations
### Red Labels and Zones
Bearish structures and confirmations.
Used for:
• Head & Shoulders
• Inverse Cups
• Short confirmations
### Yellow Labels
Preparation phase.
These indicate that the structure is still developing and has not yet received confirmation from the PVM engine.
### Purple Structure Components
Used to highlight key swing relationships inside the XABCD sequence and improve pattern readability.
## Neckline Logic
The neckline is one of the most important decision levels inside the system.
The indicator continuously tracks neckline development and monitors:
• Breakouts
• Breakdown events
• Confirmation quality
Signals are only generated when both structural and PVM requirements are satisfied.
## Multi-Language Support
The indicator includes built-in support for:
• English
• Turkish
• Russian
• Arabic
• Hindi
All major labels, states, signals, and pattern names can be displayed in the selected language.
## Design Philosophy
The purpose of this indicator is not to predict the future.
Its objective is to identify high-quality structures and validate them using trend participation and impulse strength.
By combining classical chart patterns with volume-driven confirmation, the system attempts to detect emerging directional moves while reducing exposure to weak and deceptive breakout conditions.
This indicator is designed for traders who prefer confirmation over prediction and structure over randomness.
Индикатор

Индикатор

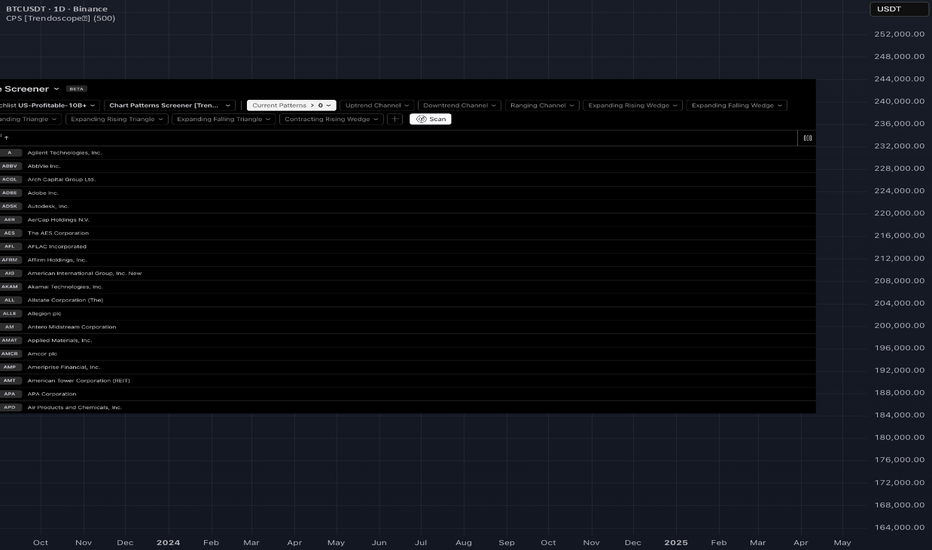
Chart Patterns Screener [Trendoscope]🎲 Overview
Chart Patterns Screener is an advanced Pine Script designed to automatically detect and display classical chart patterns on TradingView. It is a specialized, fine-tuned version of the popular Auto Chart Patterns indicator, optimized specifically for use with the Pine Screener.
🎲 How to Use This Script as Indicator
Since most of the settings are inherited from Auto Chart Patterns, let us first discuss on how to use the indicator before dwelving into the settings.
When you first add the indicator to a chart, you may see a large note or minimal visuals.
This is intentional.
Not to worry, This script is not designed to be used as a regular chart indicator. It was built primarily for scanning across many symbols using TradingView’s Pine Screener utility.
Two Ways to Use It on Chart (if still needed):
Goto the settings of the script and disable the "Note" checkbox. This will let you use the script as an indicator - however the features as indicator are limited when compared to the original Auto Chart Patterns
Use the original Auto Chart Patterns
🎲 How to Use This Script with Pine-Screener
🎯 Add Script to Favourites
You must add this script to your favourites before it appears in the Pine Screener. You can do so by clicking on "Add to favourites" button in the top right corner of the script publication page.
🎯 Open Pine Screener Utility
Pine Screener can be opened directly through the direct link - www.tradingview.com or we can go through the menus on tradingview home page to find the utility.
🎯 Load Your watchlist
Watchlist can be created manually or through other screeners.
Here is a video publication on how to use Tradingivew default stock screener which also explains how to create a watchlist by using the utility.
For this demonstration, let us use one of the pre-existing watchlist. Also note that pine-screener has a limitation that watchlist can contain maxium 1000 symbols.
🎯 Load the script/Indicator to Pine-Screener
Click on "Choose Indicator" dropdown and select the Chart Pattern Screener from the alphabetically sorted list of indicators. Please note that the dropdown will only have the indicators that are marked as favourites.
Indicator settings and timeframe can be further changed to suit the needs.
🎯 Select Scanning Criteria and Scan
Indicator settings can have some options shown by default. However, users can click on the + symbol next to "Scan" button to explore other options Availlable.
Current Patterns - contain the number of any pattern available on specific instrument. Hence, they can be used to catch symbols having any pattern on the chart.
Other options however are to catch symbols having specific type of patterns
All the filter options have number of patterns of specific types actively present on each instruments. Hence, in order to filter the symbols having these types of patterns, we just need to set the condition if the value is more than 0
Examples
To find symbols with any active pattern:
Set condition: Current Patterns > 0
To find specific patterns (example):
Set condition: Rising Wedge > 0 to filter symbols having Rising Wedge patterns
Set condition: Ascending Channel > 0 to filter symbols having Ascending Channel patterns
Set condition: Contracting Triangle > 0 to filter symbols having Contracting Triangle patterns
Once you set the conditions, you can click on Scan to filter the watchlist
🎲 Settings Overview
🎯 Screener Settings
This group of settings contain parameters that are related to screener functionality.
A pattern formed 1000 bars ago may not really mean anything as all the trading opportunity of that pattern would be already over. Hence, in order to find active patterns we need to limit on how many bars back we should check. We provide two options to identify how far we need to look back
Fixed - In the fixed option, we rely on the Fixed number of bars to look back for active patterns. If Fixed bars are 20, this means, we only look for patterns that are formed in last 20 bars.
Relative - This is slightly complex option where number of bars to look before depends on the size of the pattern. We set the percentage of size as number of bars through input. This means, if the pattern spawns 100 bars, the screener will flag it only if it is formed within 20 bars (considering 20% is set as relative percent). However, bigger pattern spawing 150 bars will be flagged if it has formed within 30 bars.
🎯 Chart Pattern Settings
These settings are same as what is defined in Auto Chart Patterns .
🎲 Refernces
Pine Screener - Powerful tool for building programmable screener
Tradingview Stock Screener - Simple and powerful tool
Auto Chart Patterns .
Индикатор
Black Merton Volatility Engine [JOAT]Black Merton Volatility Engine
Introduction
Black Merton Volatility Engine blends multiple realized-volatility estimators with expected-move rails, cone rank, jump pressure, and tail-state classification.
This open-source indicator is designed as a context tool, not a standalone trading system. It focuses on explaining the current market state with restrained visuals and confirmed-bar logic where signals are used.
Core Concepts
1. Composite Realized Volatility
Close-to-close, Parkinson, Garman-Klass, Rogers-Satchell, and Yang-Zhang-style estimates contribute to the volatility state.
2. Volatility Cone
Current volatility is ranked against a historical cone to identify squeeze and shock conditions.
3. Expected Move Rails
Annualized volatility is converted into a multi-day expected move around price.
4. Tail and Jump Pressure
Large returns, rail breaches, and volatility divergence contribute to tail and jump states.
expectedMove = close * realizedVol * math.sqrt(days / 252)
Features
Composite realized volatility
Expected-move rails
Squeeze and shock regimes
Gamma pin, tail shock, clean expansion, and jump labels
Movable quant HUD
Input Parameters
Fast, base, and slow vol windows
Vol cone window
Expected move days
Squeeze and shock percentiles
Cooldown and display toggles
How to Use This Script
Use the rails as volatility context. Squeeze, shock, tail, and jump states describe volatility conditions, not a certain direction.
Limitations
The script uses historical OHLCV data and cannot know future prices.
Signals and states can be late during fast reversals because confirmed-bar logic is used to reduce repainting.
Model outputs should be interpreted with market context, risk controls, and independent analysis.
No visual state should be treated as a certain trade outcome.
Originality Statement
BMV is original in blending several volatility estimators, cone ranking, jump pressure, and expected-move visualization.
Disclaimer
This indicator is provided for educational and informational purposes only. It is not financial advice, investment advice, or a recommendation to buy or sell any financial instrument. All calculations are derived from historical market data and may produce inaccurate readings in some market conditions. No indicator can predict future market behavior. Use proper risk management and independent judgment.
-Made with passion by jackofalltrades
Индикатор

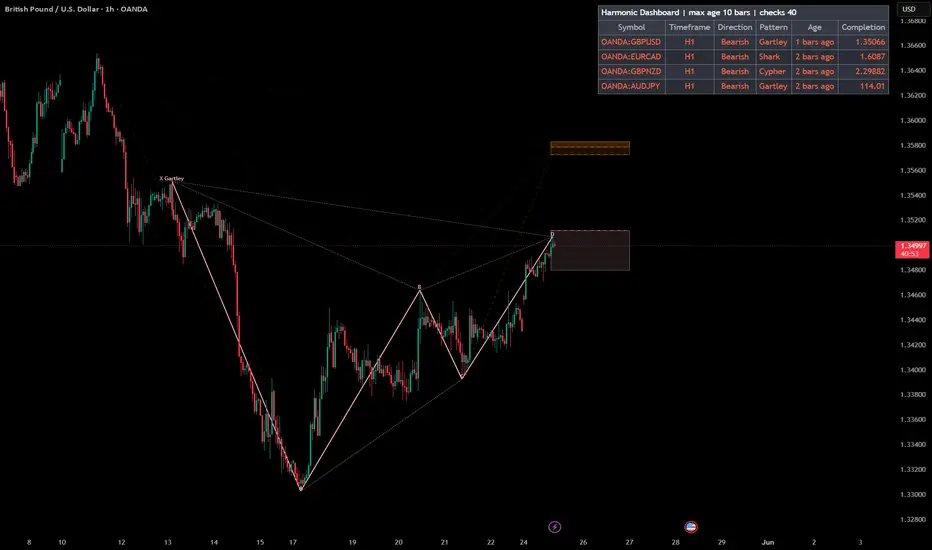
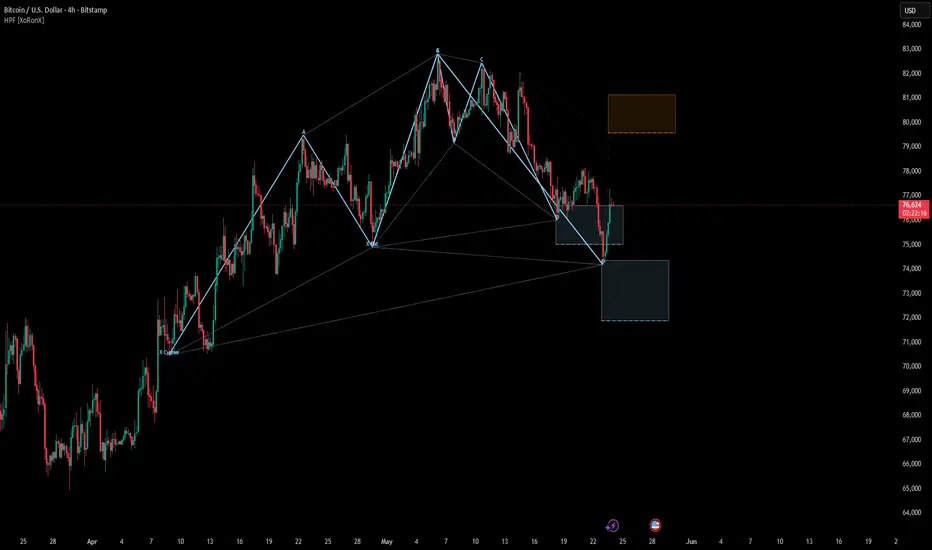
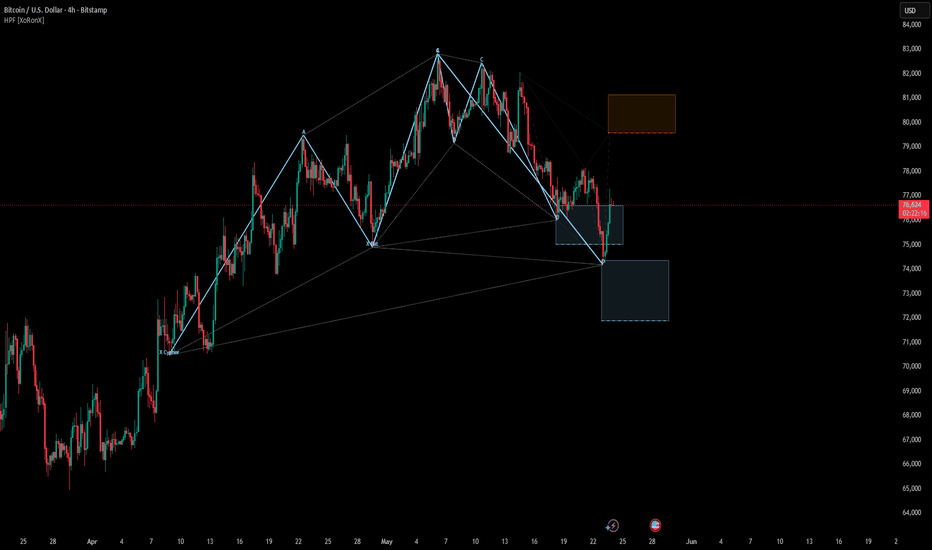
Harmonic Pattern Finder - Scanner [XoRonX]Harmonic Pattern Finder - Scanner is a Pine Script port and adaptation of the original MetaTrader 5 indicator “Harmonic Pattern Finder V3”.
This indicator scans price swings using an ATR-based ZigZag engine and identifies harmonic pattern structures based on Fibonacci ratio rules. It can display completed patterns, emerging projections, PRZ/PRS zones, ratio lines, and focused pattern details directly on the chart.
Supported patterns include:
Bat, Butterfly, Shark, Cypher, Crab, Deep Crab, and Gartley.
The scanner version also includes a multi-symbol dashboard for monitoring selected OANDA pairs and timeframes from one chart, subject to TradingView’s `request.security()` limits.
Features:
- ATR ZigZag based swing detection
- Harmonic pattern validation using Fibonacci ratio windows
- Completed and emerging pattern display
- PRZ / PRS line and box visualization
- Optional ratio lines and pattern labels
- Multi-pair scanner dashboard in the scanner version
- Configurable symbols, timeframes, colors, filters, and display limits
Credit and Source:
This TradingView version was created from and inspired by the original MQL5 source code:
(www.mql5.com)
Original MQL5 page notes that the indicator was a joint work between Andre Enger and David Gadelha and was published in the MQL5 CodeBase in 2018.
Disclaimer:
This indicator is intended for technical analysis and educational use only. Harmonic patterns do not guarantee future price movement. Always use proper risk management and confirm signals with your own trading plan. Индикатор

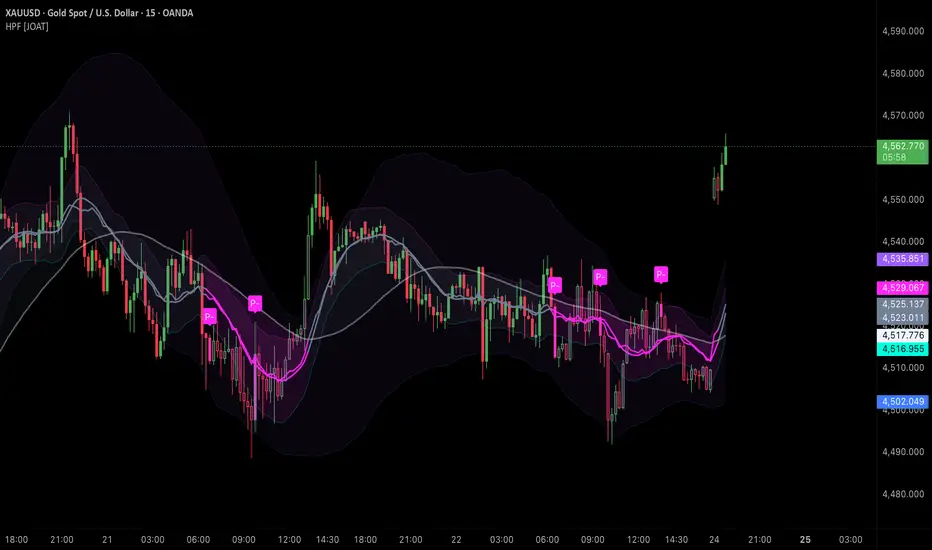
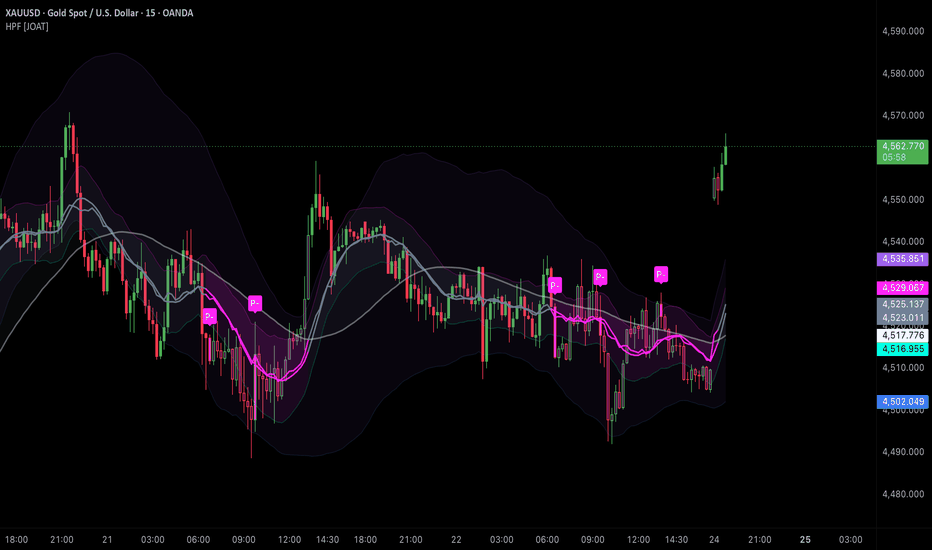
Helios Pullback Framework [JOAT]Helios Pullback Framework
Introduction
Helios Pullback Framework evaluates pullback quality using ALMA trend stack, regression trajectory, pullback depth, wick recovery, liquidity capture, compression, and HTF bias.
This open-source indicator is designed as a context tool, not a standalone trading system. It focuses on explaining the current market state with restrained visuals and confirmed-bar logic where signals are used.
Core Concepts
1. ALMA Trend Stack
Fast and slow ALMA lines define execution and institutional spines.
2. Regression Trajectory
A regression envelope provides dynamic path context rather than static zones.
3. Pullback Quality
Pullback depth, wick recovery, phase impulse, and stretch are scored.
4. Liquidity Capture
Confirmed sweeps of recent highs or lows contribute only when aligned with bias.
score = bias + pullDepth + wickRecovery + sweep + compression + htf
Features
ALMA trend stack
Regression trajectory envelope
Pullback depth and wick recovery scoring
Liquidity capture markers
Sparse P+ and P- labels
Input Parameters
ALMA lengths
Volatility and trajectory length
HTF and optional session gate
Signal score, cooldown, and max stretch
Display toggles
How to Use This Script
Use P+ and P- labels as pullback-quality events inside an existing bias. Gold circles mark liquidity capture without full confirmation.
Limitations
The script uses historical OHLCV data and cannot know future prices.
Signals and states can be late during fast reversals because confirmed-bar logic is used to reduce repainting.
Model outputs should be interpreted with market context, risk controls, and independent analysis.
No visual state should be treated as a certain trade outcome.
Originality Statement
Helios is original in replacing supply/demand boxes with a cleaner model that scores pullback elasticity, trajectory, and liquidity capture.
Disclaimer
This indicator is provided for educational and informational purposes only. It is not financial advice, investment advice, or a recommendation to buy or sell any financial instrument. All calculations are derived from historical market data and may produce inaccurate readings in some market conditions. No indicator can predict future market behavior. Use proper risk management and independent judgment.
-Made with passion by jackofalltrades
Индикатор
Concordance Execution Model [JOAT]Concordance Execution Model
Introduction
Concordance Execution Model is a strategy framework that integrates regime detection, trend bias, structure direction, pressure, relative volume, regression confidence, and ATR risk management.
This open-source strategy is a research framework, not a performance claim. It demonstrates how rule-based confluence, realistic costs, risk controls, and confirmed-bar execution can be organized in Pine Script v6.
Core Concepts
1. Regime Filter
ALMA, EMA, structure, and regression confidence determine whether long or short entries are allowed.
2. Multi-Factor Entry Gate
Entries require confirmed structure or pullback context plus pressure, RVOL, and cooldown alignment.
3. ATR Risk Model
Stops, targets, trailing stops, structure invalidation, and time stops manage exits.
4. Confirmed-Bar Execution
Entry conditions are evaluated with confirmed bars to reduce repainting behavior.
longEntry = confirmed and regimeBull and pressureBull and rvolOk and cooled
Features
Regime, structure, pressure, and regression filters
ATR stop and target exits
Optional trailing stop
Structure invalidation and time stop exits
Dashboard and candle regime colors
Input Parameters
Structure pivot length and HTF bias
ALMA and regression confidence settings
Delta pressure, RVOL, and cooldown
ATR stop, target, trailing, and time stop
Panel and candle display toggles
Strategy Properties
Initial capital: 100000
Position sizing: 10 percent of equity
Pyramiding: 0
Commission: 0.02 percent
Slippage: 2 ticks
Stops and targets: ATR-based, with optional trailing stop
How to Use This Script
Use this as a transparent research framework. Test on multiple markets and review trade samples rather than relying on a single backtest.
Limitations
The script uses historical OHLCV data and cannot know future prices.
Signals and states can be late during fast reversals because confirmed-bar logic is used to reduce repainting.
Model outputs should be interpreted with market context, risk controls, and independent analysis.
No visual state should be treated as a certain trade outcome.
Originality Statement
Concordance is original in combining several independent model families into a realistic, non-pyramiding execution framework with explicit risk exits.
Disclaimer
This indicator is provided for educational and informational purposes only. It is not financial advice, investment advice, or a recommendation to buy or sell any financial instrument. All calculations are derived from historical market data and may produce inaccurate readings in some market conditions. No indicator can predict future market behavior. Use proper risk management and independent judgment.
-Made with passion by jackofalltrades
Стратегия

Harmonic Pattern Finder - [XoRonX]Overview
Harmonic Pattern Finder is an institutional-grade, fully automatic pattern detection and projection tool designed to identify and scan harmonic patterns on your charts in real time. Ported to Pine Script v6, this advanced version introduces volatility-based swing detection, multi-criteria structural filtering, real-time projections, and built-in historical statistics.
The indicator uses a dynamic ATR-based ZigZag engine to establish structural swings. It then checks these swings against precise Fibonacci ratio rules to identify both completed and emerging harmonic structures, outlining the exact Potential Reversal Zone (PRZ) for potential trade setups.
---
Supported Patterns
This indicator automatically scans for 7 classic harmonic pattern variations (supporting both Bullish and Bearish structures):
Gartley
Bat
Butterfly
Crab
Deep Crab
Cypher
Shark
Each pattern can be individually toggled on or off in the user settings.
---
Key Features
# 1. Volatility-Adaptive ZigZag Engine
Unlike static depth-based ZigZags, this script uses an Average True Range (ATR) filter. This allows swing points to dynamically adapt to shifting market volatility across different assets, timeframes, and market conditions.
# 2. Potential Reversal Zone (PRZ) Boxes & Lines
For every detected pattern, the indicator plots a highlighted PRZ Box and a PRZ Line extending into the future.
PRZ Box: Clearly visualizes the range between the near and far target zones.
PRZ Extensions: Extends to the right, letting you monitor price reactions upon entering the zone.
# 3. Real-time Projections & Emerging Patterns
Never miss a setup. The indicator displays:
Confirmed Patterns: Completed structures.
Transient & Emerging Patterns: Patterns that are actively developing in real time.
One-Ahead Projections: Projects the D-leg before it completes, allowing you to prepare for potential entries in advance.
# 4. Leg Balance & Time Filters
Eliminate noisy, deformed, or rushed structures. The script incorporates:
Leg Balance Filter: Verifies that the time duration (number of bars) of each leg (XA, AB, BC, CD) is balanced and proportional.
Time Filters: Eliminates patterns that complete "too early" or "too late" relative to the structural timeframe of the pattern.
Purist PRZ: Filter patterns that don't have their Fibonacci ratios landing precisely in the PRZ.
# 5. Focus Details Mode
Enable the Focus Details setting to isolate a specific pattern and display detailed target Fibonacci ratios (AD2XA, CD2XC, CD2BC, etc.) and time targets ("early", "ideal", "late" boundaries) directly on the chart.
# 6. Live Statistical Dashboard (Win-Rate Table)
A clean, table-based dashboard on the top-left calculates historical pattern outcomes based on the visible chart history:
P. (Persistent / Completed)
T. (Transient / Active)
O. (Overshot / Failed)
It calculates and displays the historical success probability for each pattern.
---
How to Trade with This Indicator
Identify the PRZ: Watch for the highlighted box and lines when a pattern is nearing completion.
Wait for Price Action Confirmation: Do not blindly enter at the PRZ. Look for reversal candlestick patterns (e.g., pinbars, engulfing candles) or momentum divergence (RSI/MACD) inside the PRZ box.
Stop Loss (SL): Positioned just beyond the "PRZ Stop" line (the far limit of the PRZ).
Take Profit (TP): Typically targeted at key Fibonacci retracements of the AD leg (usually 38.2% and 61.8%).
---
*Disclaimer: Harmonic patterns are structural guides and are most effective when combined with other indicators (RSI, volume, key support/resistance) and proper risk management. Past performance does not guarantee future results.* Индикатор
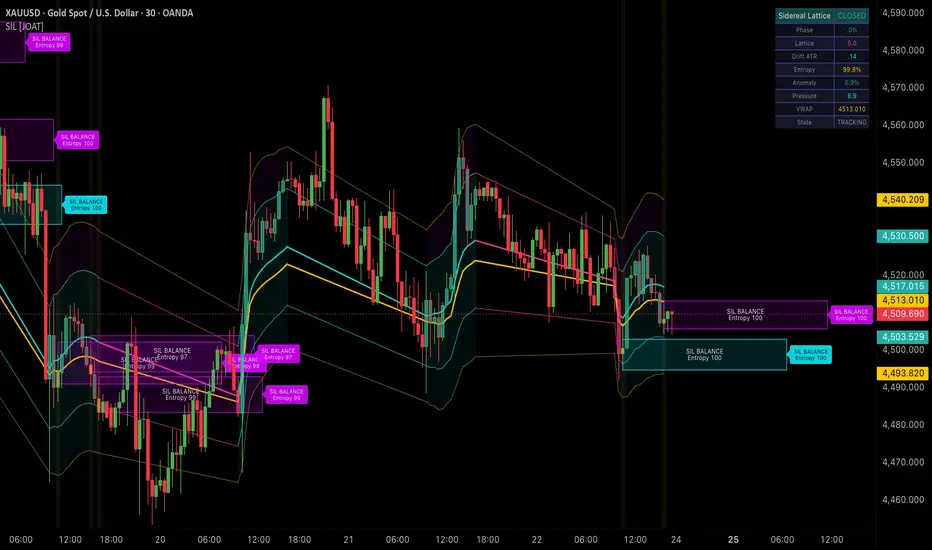
Sidereal Session Lattice [JOAT]Sidereal Session Lattice
Introduction
Sidereal Session Lattice is an open-source intraday session-orbit indicator. It maps session phase, VWAP drift, volatility harmonics, entropy, and anomaly pressure into adaptive orbit bands and compact phase cells.
The indicator is designed to answer a session-context question: is price moving with the current session phase, stretching beyond its orbit, or compressing into balance?
Core Concepts
1. Session Phase
Each active session is counted bar by bar. The bar count is converted into a normalized phase value from 0 to 1.
2. Harmonic Orbit
The phase value is transformed with sine waves to create an intraday harmonic component. This does not predict price; it creates a reference curve for studying session rhythm.
3. VWAP Drift
The script tracks the distance between price and session VWAP, then normalizes the drift by ATR.
4. Entropy and Anomaly Rank
The script compares recent up/down candle energy and return magnitude to estimate balance and anomaly pressure.
5. Phase Cells
Compact cells mark upper-orbit events, lower-orbit events, and balance compression.
Features
Session phase model: Tracks where the market is inside the active session cycle
VWAP drift: Measures price displacement from session VWAP
Harmonic orbit bands: Adaptive bands based on phase, volatility, and drift
Entropy score: Measures up/down energy balance
Anomaly rank: Highlights unusual movement relative to recent behavior
Phase cells: Compact boxes show session-orbit events
Dashboard: Shows phase, lattice score, drift, entropy, anomaly, and current state
Input Parameters
Primary session defines the active session window
Cycle bars controls the phase cycle length
Drift smoothing controls VWAP drift smoothing
Entropy memory controls bid/ask balance memory
Anomaly memory controls return-rank comparison
How to Use This Indicator
Step 1: Read the phase state
The dashboard names the current session phase, such as open drive, balance, or close risk.
Step 2: Watch orbit events
Upper and lower orbit cells mark when price stretches beyond the adaptive session orbit.
Step 3: Use entropy for balance context
High entropy with low anomaly often indicates balanced conditions.
Indicator Limitations
The harmonic orbit is a reference model, not a forecast
Session behavior varies by symbol and exchange hours
Entropy and anomaly values are derived from chart bars and may change with timeframe
Originality Statement
Sidereal Session Lattice combines session phase, VWAP drift, harmonic references, entropy, and anomaly ranking. It is not a standard session high/low tool; it provides a structured way to study intraday rhythm and displacement.
Disclaimer
This indicator is provided for educational and informational purposes only. It is not financial advice. Session models can fail in news, gaps, and unusual liquidity conditions.
-Made with passion by jackofalltrades
Индикатор

Session Probability Grid [JOAT]Session Probability Grid
Introduction
Session Probability Grid is an open-source session auction map. It builds percent-based ladder levels from the active session open, tracks historical hit behavior for those levels, and displays probability-style context for expansion, exhaustion, and unusual session movement.
The problem it solves is session framing. Traders often know the open is important, but they may not know whether a move is normal for the current symbol and timeframe. This script records session outcomes and converts them into visible ladder probabilities.
Core Concepts
1. Session Open Ladder
The script creates six upside and six downside levels from the session open using configurable percentage steps. These levels frame how far price has moved away from the open.
2. Historical Hit Memory
At the end of each session, the script updates arrays storing hit counts, sample counts, and continuation distance. This creates a rolling sample of how often each ladder has been reached.
3. Opening Range Context
The first configurable number of bars defines the opening range. The session box and opening range box help distinguish early balance from later expansion.
4. Expansion and Exhaustion States
Expansion states identify movement through areas with supportive historical behavior. Exhaustion states mark stretched locations where continuation may be less reliable.
5. Session VWAP Gradient
The optional session VWAP gradient adds a live auction mean reference so ladder movement can be compared against the developing session control line.
Features
Open-relative ladder: Six upside and six downside levels based on configurable percent steps.
Statistical memory: Tracks hit count, sample count, and continuation distance from completed sessions.
Probability cards: Right-side cards show ladder behavior without crowding price.
Expansion and exhaustion states: Highlights meaningful session movement conditions.
Session and opening range boxes: Frames current auction development.
Session VWAP gradient: Adds a developing mean reference.
Candle coloring: Bars can be colored by session state.
Dashboard: Shows session state, nearest ladder, hit probability, expected continuation, and range condition.
Alerts: Upside expansion, downside expansion, upper exhaustion, and lower exhaustion.
Input Parameters
Core Session: Active Session, Opening Range Bars, Stat Sample Cap, Session Range Box, Opening Range Box.
Ladder: Open-Relative Ladders and Step 1 through Step 6.
Signals and Visuals: Auction State Zones, State Projection Bars, Continuation Probability Gate, Right Probability Cards, Session Candle Color, Session VWAP Gradient, Dashboard.
How to Use This Indicator
Step 1: Start from the session open
The ladder levels are built from the open, so they frame the current session relative to its starting price.
Step 2: Compare price to the ladder
As price approaches a ladder level, check the probability card and dashboard for historical hit and continuation context.
Step 3: Distinguish expansion from exhaustion
Expansion and exhaustion states help separate normal auction development from stretched movement.
Indicator Limitations
Probabilities are based on the chart's available historical sessions and are not universal statistics.
Session boundaries depend on the selected exchange/session setting.
The script needs enough completed sessions to build useful samples.
Probability context does not predict future price.
Originality Statement
Session Probability Grid is original in its combination of open-relative ladders, rolling hit memory, continuation-distance storage, session VWAP context, opening range framing, and expansion/exhaustion visualization. It is not just a static percent-level tool; it updates its context from completed session behavior.
Disclaimer
This script is for educational and informational purposes only. It is not financial advice and does not recommend trades. Historical session behavior may not repeat. Use independent analysis and risk management.
Made with passion by jackofalltrades
Индикатор

ABCD Pattern Finder**Detailed Indicator Description**
Your indicator is an **ABCD Pattern Finder** for TradingView. It scans price action for swing-based **AB=CD harmonic-style patterns**, confirms whether the pattern meets your rules, then plots the pattern and related trade levels directly on the chart.
**Core Purpose**
The indicator is designed to find situations where price makes:
**A to B:** an initial impulse move.
**B to C:** a retracement or pullback.
**C to D:** a second move that is approximately equal to the A-to-B move.
When the C-to-D leg completes and passes the filter rules, the indicator treats point **D** as the trade-confirmation area. It then displays an entry reference, stop loss, and three take-profit levels.
**Bullish and Bearish Logic**
A **bullish setup** is one where the completed pattern suggests a potential long trade after point D.
A **bearish setup** is one where the completed pattern suggests a potential short trade after point D.
The indicator uses the sequence of highs and lows to decide whether the pattern is bullish or bearish. It does not simply mark every four-point swing; the swing sequence must form a valid ABCD structure.
**Zigzag Inputs**
**Pivot Bars Left** controls how many bars to the left must be considered when confirming a swing high or swing low.
**Pivot Bars Right** controls how many bars to the right must pass before a pivot is confirmed.
Higher values make the indicator less sensitive and produce fewer patterns. Lower values make it more sensitive and produce more patterns, but with more noise.
**Pattern Quality Inputs**
**Min CD/AB Time Ratio** sets the minimum amount of time the CD leg must take compared with the AB leg. This prevents CD from forming too quickly.
**Max CD/AB Time Ratio** sets the maximum amount of time CD can take compared with AB. This prevents slow, dragged-out CD legs from qualifying.
**AB=CD Equality Tolerance** controls how close the CD leg must be to the AB leg in price size. A value of **0.10** means CD can be within plus or minus 10% of AB.
**Min BC Retracement of AB** sets the shallowest acceptable pullback from B to C.
**Max BC Retracement of AB** sets the deepest acceptable pullback from B to C.
**Min AB Size ATR Multiple** requires the AB leg to be large enough compared with ATR. This helps filter out small, low-quality patterns.
**ATR Length** controls the ATR calculation used for volatility-based filtering and stop placement.
**Disallow Pattern Overlap** prevents a new pattern from being confirmed inside the range of an already confirmed pattern.
**Trade Inputs**
**Stop ATR Buffer Beyond D** places the stop loss beyond point D by a volatility-based buffer. A larger value gives the trade more room, while a smaller value creates a tighter stop.
**TP1 Fibonacci Level** sets the first profit target based on the A-to-D range.
**TP2 Fibonacci Level** sets the second profit target.
**TP3 Fibonacci Level** sets the third profit target.
The default target structure is TP1 at **0.618**, TP2 at **1.0**, and TP3 at **1.382** of the A-to-D range.
**Display Inputs**
**Trade Display Bars Forward** controls how far the entry, stop, and target lines extend to the right of the current candle.
**Show Trade Levels** turns entry, stop loss, and target lines on or off.
**Show ABCD Lines** turns the A-B, B-C, and C-D pattern lines on or off.
**Show ABCD Labels** turns the A, B, C, and D labels on or off.
You can also customize colors for the confirmed pattern, entry line, stop line, and target lines.
**Historical Pattern Inputs**
**Show Historical AB=CD Patterns** controls whether older confirmed patterns remain visible.
**Historical Closed Lookback** controls how many recently closed patterns are included in the historical visual/stat window.
**Closed Trade Lookback** lets you visually rewind and highlight a previous closed trade. A value of **0** shows the most recent trade. A value of **1** shows the trade before that.
**Closed Trade Lookback Color** controls the color used when reviewing an older closed trade.
**Confirmation Triangles**
The indicator can plot a triangle when a pattern is confirmed.
A bullish confirmation uses the bullish triangle color.
A bearish confirmation uses the bearish triangle color.
You can turn these triangles on or off and choose their size: **Tiny, Small, Normal, or Large**.
**AD Line Inputs**
The indicator can draw a line from point **A** to point **D**, extended to the right.
You can control whether this line appears, plus its color, width, and style: **Solid, Dashed, or Dotted**.
**Stats Window**
The stats window displays historical performance for TP1, TP2, and TP3.
For each target, it shows:
**Wins:** how many closed trades reached that target.
**Closed:** how many closed trades were evaluated.
**Rate:** the win rate for that target.
The stats are recalculated using your current trade input settings, so changing stop or target values updates the displayed historical results.
**Alerts**
The indicator includes two alerts:
**New ABCD Pattern Detected** triggers when a valid pattern is found.
**ABCD Pattern Entry at D** triggers when the pattern confirmation/entry condition occurs at point D.
Индикатор

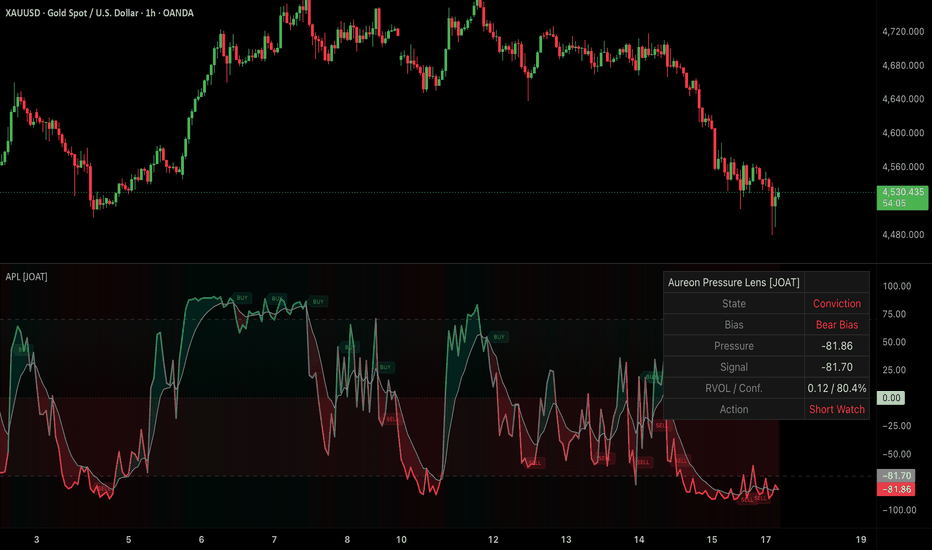
Aureon Pressure Lens [JOAT]Aureon Pressure Lens
Introduction
Aureon Pressure Lens is an open-source pressure oscillator designed to classify directional participation, conviction, and transition states in a separate pane. It blends price impulse, EMA structure, momentum, range location, candle body pressure, and relative volume into one bounded score.
The problem it solves is signal quality. A single oscillator can fire during weak, low-participation moves. Aureon Pressure Lens requires pressure, signal-line behavior, relative volume, and component consensus to align before confirmed buy or sell labels appear.
Core Concepts
1. Multi-Component Pressure Blend
The oscillator uses several independent inputs: impulse from prior price, fast/slow structural slope, normalized momentum, range position, and candle body direction.
2. Tanh Normalization
Each component is normalized into a stable bounded range so one volatile input does not dominate the entire reading.
pressureScore = f_tanh(pressureBlend * 1.60) * 100.0
signalLine = ta.ema(pressureScore, signalLength)
3. Consensus Filter
The confidence reading measures how closely the components agree. A signal must satisfy the minimum conviction threshold before it can print.
4. Relative Volume Participation
The script measures current volume against a moving average and uses that reading as a participation gate. The default is permissive enough for broad use while still filtering extremely quiet conditions.
Features
Separate-pane pressure score: Bounded -100 to +100 directional pressure reading
Signal line: Smoothed reference for pressure resets and crossovers
Gradient pressure color: Score color transitions between bearish, neutral, and bullish states
Pressure cloud: Optional fill between pressure and signal line
Confirmed BUY/SELL labels: Closed-bar events filtered by consensus and RVOL
Top-right dashboard: State, bias, pressure, signal, RVOL/conviction, and action
Alerts: Bullish and bearish confirmed pressure resets
Input Parameters
Calculation:
Core Lookback: Main analysis window for impulse and range context
Fast Lens / Slow Lens: EMA structure lengths
Signal Lens: Smoothing length for the signal line
Pressure Sensitivity: Normalization intensity
Min Relative Volume: Participation gate for labels
Min Conviction: Minimum component agreement required for labels
How to Use This Indicator
Step 1: Read the pressure score relative to zero.
Step 2: Use the cloud and signal line to identify pressure resets.
Step 3: Check dashboard conviction and RVOL before acting on labels.
Step 4: Combine with an overlay structure or regime tool for full chart context.
Indicator Limitations
The oscillator measures current pressure, not future price direction
Relative volume can behave differently on symbols with limited volume data
Choppy markets can create repeated signal-line crosses
Confirmed labels appear only after the bar closes
Originality Statement
Aureon Pressure Lens is original because it combines impulse, structure, momentum, range position, candle body pressure, relative volume, and component consensus into a single closed-bar pressure engine with a dedicated dashboard. It does not copy third-party source code.
Disclaimer
This open-source indicator is for educational and informational purposes only. It is not financial advice. Markets can change quickly, and no pressure reading guarantees a future move. Use risk controls and independent analysis.
-Made with passion by jackofalltrades
Индикатор
Wolfe Wave Indicator**Wolfe Wave Indicator Description**
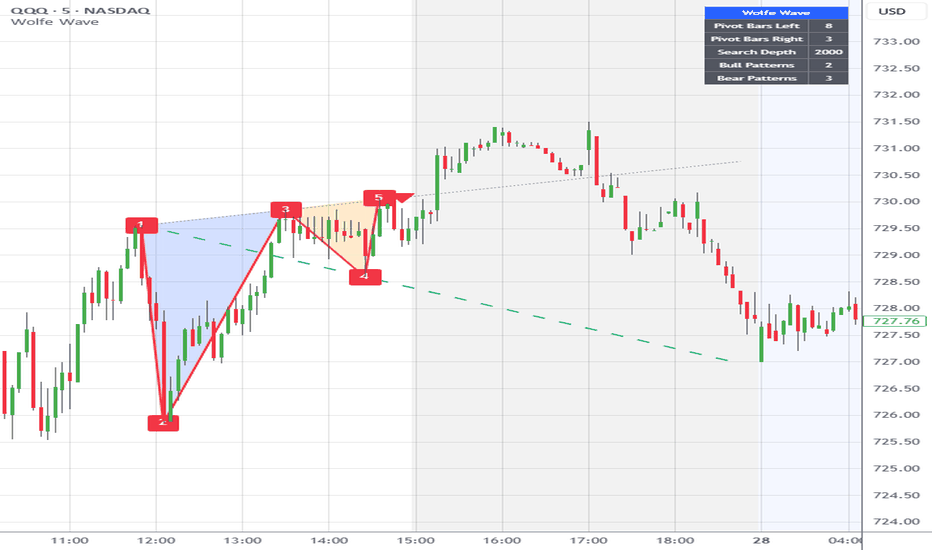
This indicator is a strict Wolfe Wave scanner and trade tracker built for cleaner pattern identification, trade-level plotting, and simple performance tracking.
It detects bullish and bearish Wolfe Wave structures from confirmed pivot highs and lows. A bullish setup requires a five-point sequence where point 3 is lower than point 1, point 5 is lower than point 3, point 4 remains inside the point 1 to point 2 price range, and point 5 forms near the projected point 1 to point 3 line. A bearish setup uses the inverse structure, requiring point 3 above point 1, point 5 above point 3, point 4 inside the point 1 to point 2 range, and point 5 near the projected point 1 to point 3 line.
The pattern begins as a pending Wolfe Wave once the five-point structure is detected. A trade confirms only after price closes back inside the point 1 to point 3 line. The script supports two entry styles: confirmation close or point 4 break. The stop loss is placed beyond point 5, with an optional tick buffer.
Targets are based on the Wolfe Wave EPA line. The EPA line is drawn from point 1 to point 4. TP1, TP2, and TP3 are calculated as user-defined portions or extensions of the distance from entry to the EPA line value at confirmation. By default, TP1 is halfway to the EPA line, TP2 is the EPA line target, and TP3 is an extension beyond the EPA line.
Trades remain open until either the stop loss is hit or TP3 is reached. TP1 and TP2 are tracked as partial target achievements, but they do not close the trade. Stats update only when a trade is fully closed. If the stop and TP3 are both touched on the same candle, the stop has priority.
By default, the indicator allows only one open Wolfe trade at a time. While one trade is open, no new Wolfe pattern will form or confirm. This is intentional and keeps the stats cleaner by avoiding overlapping trade signals. A user toggle is included to allow multiple open trades for those who want to use it more like a pattern scanner.
Visual behavior is simple. Pending patterns are yellow. Confirmed active trades are orange and display entry, stop loss, TP1, TP2, and TP3 levels. Closed historical patterns are purple. A display option allows the EPA line and point 1 to point 3 projection line to appear only on pending or active patterns, keeping historical patterns cleaner and reducing chart clutter.
This indicator is designed as a structured Wolfe Wave trade model, not a loose discretionary drawing tool. It uses strict validation rules, confirmed pivots, defined entry logic, defined stop logic, EPA-based targets, and closed-trade statistics.
Индикатор
Индикатор

Crossframe Bias Ledger [JOAT]Crossframe Bias Ledger
Introduction
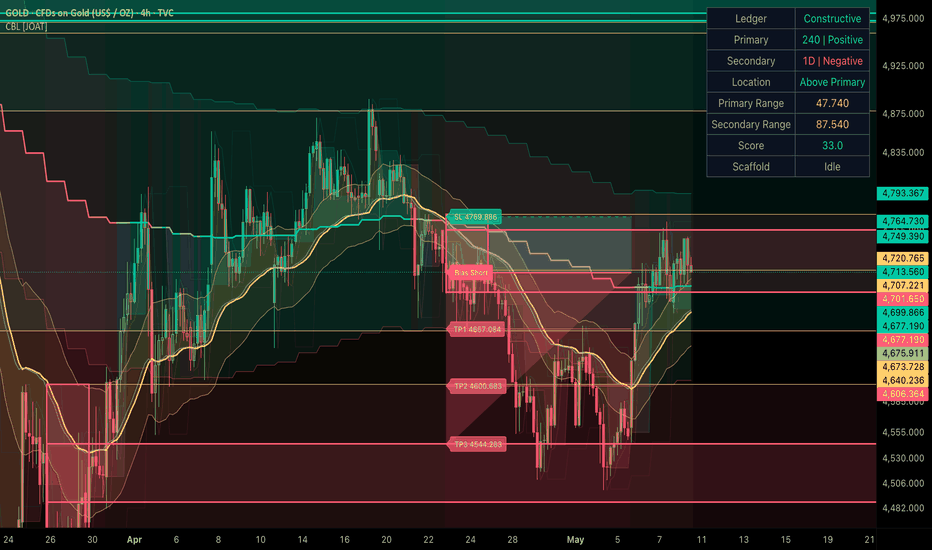
Crossframe Bias Ledger is an open-source non-repainting higher-timeframe bias overlay built to align an intermediate timeframe, a major timeframe, and the local chart into one directional map. It uses safely delayed `request.security()` calls, crossframe basis clouds, premium/discount rails, alignment boxes, execution-state labels, and an optional TP/SL scaffold on fresh confirmed alignment shifts.
The script solves directional context across timeframes. Many local signals fail because they are taken against dominant higher-timeframe structure. Crossframe Bias Ledger keeps the user anchored to higher-timeframe alignment while still making the output actionable on the trading timeframe.
Core Concepts
1. Safe Higher-Timeframe Requests
All higher-timeframe values are retrieved using delayed indexing so incomplete higher-timeframe bars do not leak into the current chart:
idxHigher = barstate.isrealtime ? 1 : 0
idxCurrent = barstate.isrealtime ? 0 : 1
2. Primary and Secondary Trend Stacks
Fast, slow, and signal EMAs are retrieved from two higher timeframes and converted into directional scores.
3. Premium / Discount Map
The two higher-timeframe bases define a premium/discount zone. Price trading above the upper rail is treated as premium. Price trading below the lower rail is treated as discount. Price between them is treated as rebalancing.
4. Fresh Alignment Shifts
When the crossframe score crosses into confirmed bullish or bearish alignment, the script marks this as a fresh state transition and can build an informational TP/SL ladder.
5. Rebalance vs Continuation Logic
The script distinguishes rebalancing entries inside the premium/discount box from continuation conditions outside it.
Features
Non-repainting crossframe logic: Uses safely delayed higher-timeframe requests
Dual cloud system: Primary and secondary timeframe clouds on the chart
Premium / discount rails: Crossframe valuation map between the two HTF bases
Bias box: Forward execution window for the current crossframe state
Fresh alignment detection: Distinguishes a new bull/bear shift from an already active state
Continuation and rebalance readouts: Shows whether price is extending or rebalancing
Optional TP/SL ladder: Informational scaffold for new alignment shifts
Top-right dashboard: Displays state, signal, timeframe bias, location, execution mode, basis, and score
How to Use This Indicator
Step 1: Read whether the state is aligned up, aligned down, or mixed.
Step 2: Check if price is trading in premium, discount, or rebalance territory.
Step 3: Use fresh shifts to identify new state transitions. Use continuation and rebalance readings to differentiate execution style.
Step 4: Keep local entries aligned with the dominant crossframe bias whenever possible.
Indicator Limitations
Higher-timeframe logic is intentionally delayed for safety, so it will not react as quickly as unstable lookahead-based implementations
Premium/discount interpretation depends on the chosen timeframes
Mixed states are intentional and may persist when higher timeframes disagree
The TP/SL ladder is informational and does not place trades
Originality Statement
Crossframe Bias Ledger is original in the way it combines safe higher-timeframe delay logic, dual-basis premium/discount mapping, fresh alignment shifts, and execution-state scaffolding into one open-source overlay. The script is intended to provide a reusable top-down directional framework rather than a generic MTF trend line.
Disclaimer
This indicator is provided for educational and informational purposes only. It is not financial advice. Higher-timeframe alignment may still fail, reverse, or become mixed as new data forms. Always use independent analysis and risk management.
-Made with passion by jackofalltrades
Индикатор
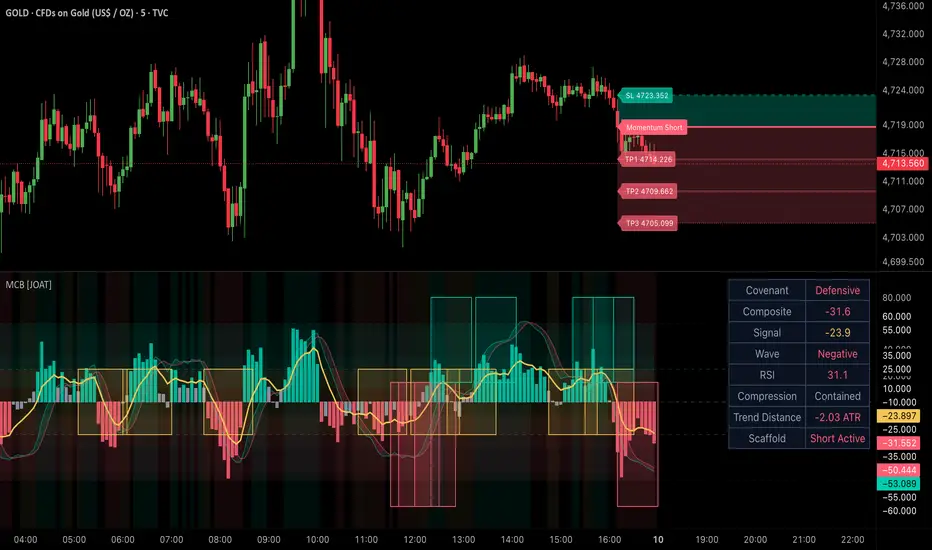
Momentum Covenant Bias [JOAT]Momentum Covenant Bias
Introduction
Momentum Covenant Bias is an open-source momentum pane designed to classify whether the market is in a constructive, defensive, balanced, or compressed state. It blends WaveTrend timing, RSI displacement, normalized trend distance, compression logic, layered state bands, pane boxes, and an optional force-overlay TP/SL scaffold when fresh confirmed momentum shifts occur.
This indicator is meant to solve timing. Trend and auction context can describe where the market is, but they do not always tell you whether momentum is actually participating in the current move. Momentum Covenant Bias translates several independent momentum dimensions into one composite state engine and presents them in a clean, institutional-style pane.
Core Concepts
1. WaveTrend Timing
WaveTrend serves as the primary turning-point rhythm engine. The script uses the relationship between the main line and signal line to measure timing pressure.
2. RSI Displacement
RSI is evaluated not only relative to 50, but also relative to its own smoothed mean. This helps distinguish raw strength from persistent displacement.
3. Normalized Trend Distance
Price distance from the slower trend baseline is normalized by ATR so the output remains portable across markets with different price scales.
4. Compression State
Compression logic compares recent range behavior to a slower baseline. This helps identify lower-energy conditions before expansion.
5. State Boxes and Overlay Scaffold
The pane includes positive, negative, and compression zones, and can project a force-overlay TP/SL scaffold on the chart when a fresh momentum shift is confirmed.
Features
Composite momentum score: Combines WaveTrend, RSI, trend distance, and compression context
Signal line: Smoothed line for momentum transitions
Layered state bands: Positive, negative, and extension zones rendered as gradients
Compression boxes: Visual isolation of low-energy conditions
Top-right dashboard: Displays composite score, signal, wave state, RSI, compression, trend distance, and scaffold status
Force-overlay TP/SL scaffold: Optional informational rails on fresh positive or negative momentum shifts
Confirmed-bar state promotion: Uses confirmed bars for event states instead of unstable intrabar triggers
How to Use This Indicator
Step 1: Read the composite state first. Balanced states should be interpreted differently from impulse states.
Step 2: Compare the composite score to the signal line. Fresh separation often matters more than absolute level alone.
Step 3: Watch compression zones. These can help explain why a market is not yet extending despite directional context elsewhere.
Step 4: If using the optional scaffold, treat it as a planning aid that reflects momentum state, not as a standalone trade system.
Indicator Limitations
Momentum state can reverse quickly in whipsaw markets
Compression logic can remain active for extended periods in slow markets
WaveTrend and RSI are still derivatives of price and can lag during violent reversals
The overlay scaffold is informational and does not execute orders
Originality Statement
Momentum Covenant Bias is original in the way it combines multi-source momentum confirmation, pane state boxes, gradient regime presentation, and force-overlay planning rails in one open-source script. The indicator is intended as a timing layer that complements structure and auction context instead of replacing them.
Disclaimer
This indicator is provided for educational and informational purposes only. It is not financial advice. Momentum conditions are derived from historical price behavior and may fail or reverse without warning. Use proper risk management and independent validation.
-Made with passion by jackofalltrades
Индикатор

Wave Navigator Cycle [Adaptive]Wave Navigator Cycle
Overview
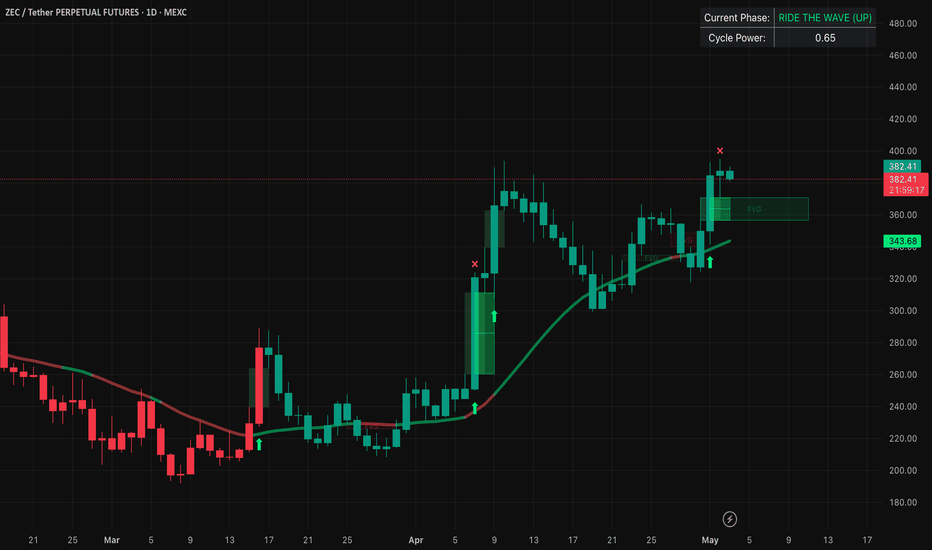
The Wave Navigator System is a comprehensive technical indicator designed to trade the "Distorted Cycle." Unlike traditional indicators that lag behind price, this system uses an Adaptive Sine Wave to map out market phases in real-time, helping traders identify when the market is in a state of Preparation, Expansion (Ride the Wave), or Distribution.
This tool integrates high-probability Smart Money Concepts (SMC) including Liquidity Sweeps, Displacement, and Fair Value Gaps (FVG) to provide a complete roadmap for trend following and reversal trading.
Key Features
1. Adaptive Sine Wave Cycle
At the core of this indicator is a dynamic sine wave anchored to an ALMA (Arnaud Legoux Moving Average).
- Preparation Phase: Price is at the cycle bottom (Low Zone), looking for Sell-Side Liquidity.
- Ride the Wave: The sine wave turns green and rises, signalling a bullish trend expansion.
- Distribution Phase: Price reaches the cycle peak (High Zone), looking for Buy-Side Liquidity.
- Displacement Down: The sine wave turns red, signalling a shift in market structure and a bearish move.
2. Liquidity Sweep Detection
The indicator automatically marks "Equal Highs" and "Equal Lows" that have been swept.
- X Marks: Buy-Side Liquidity Sweeps (Potential Short setups).
- Triangle Marks: Sell-Side Liquidity Sweeps (Potential Long setups).
3. Smart Displacement & FVGs
The system doesn't just look for big candles; it calculates Relative Displacement. When price moves with high volume and volatility, the indicator identifies Fair Value Gaps (FVG).
- Emerald Boxes: Bullish FVGs (Targets for "Retrace to FVG" longs).
- Maroon Boxes: Bearish FVGs (Targets for "Retrace to FVG" shorts).
4. Real-Time Dashboard
A built-in HUD (Heads-Up Display) in the top-right corner monitors the Cycle Power and explicitly labels the current market phase, so you never have to guess where you are in the "Distorted Cycle."
---
How to Trade with Wave Navigator
1. Identify the Zone: Look for the Sine Wave to enter the "Preparation" (Low) or "Distribution" (High) zones.
2. Wait for the Sweep: Look for a Liquidity Sweep icon to appear at the cycle extremes.
3. Confirm with Displacement: Wait for a Displacement Arrow and a coloured Sine Wave flip (Green for Up / Red for Down).
4. The Entry: Enter on the Retrace to FVG (the coloured boxes) once the wave has begun its new direction.
Settings
- Base MA Length: Adjust this to change the "frequency" of the wave (Higher = Swing Trading, Lower = Scalping).
- Displacement Sensitivity: Fine-tune how "aggressive" the price move must be to trigger an FVG.
- Sine Opacity: Customise the visual intensity of the trend wave.
Disclaimer: Trading involves significant risk. This indicator is a tool for analysis and should be used in conjunction with a robust trading plan and proper risk management.
("Updated visual presentation") Индикатор
Wave Navigator Cycle [Adaptive] Wave Navigator Cycle
Overview
The Wave Navigator System is a comprehensive technical indicator designed to trade the "Distorted Cycle." Unlike traditional indicators that lag behind price, this system uses an Adaptive Sine Wave to map out market phases in real-time, helping traders identify when the market is in a state of Preparation, Expansion (Ride the Wave), or Distribution.
This tool integrates high-probability Smart Money Concepts (SMC) including Liquidity Sweeps, Displacement, and Fair Value Gaps (FVG) to provide a complete roadmap for trend following and reversal trading.
Key Features
1. Adaptive Sine Wave Cycle
At the core of this indicator is a dynamic sine wave anchored to an ALMA (Arnaud Legoux Moving Average).
- Preparation Phase: Price is at the cycle bottom (Low Zone), looking for Sell-Side Liquidity.
- Ride the Wave: The sine wave turns green and rises, signalling a bullish trend expansion.
- Distribution Phase: Price reaches the cycle peak (High Zone), looking for Buy-Side Liquidity.
- Displacement Down: The sine wave turns red, signalling a shift in market structure and a bearish move.
2. Liquidity Sweep Detection
The indicator automatically marks "Equal Highs" and "Equal Lows" that have been swept.
- X Marks: Buy-Side Liquidity Sweeps (Potential Short setups).
- Triangle Marks: Sell-Side Liquidity Sweeps (Potential Long setups).
3. Smart Displacement & FVGs
The system doesn't just look for big candles; it calculates Relative Displacement. When price moves with high volume and volatility, the indicator identifies Fair Value Gaps (FVG).
- Emerald Boxes: Bullish FVGs (Targets for "Retrace to FVG" longs).
- Maroon Boxes: Bearish FVGs (Targets for "Retrace to FVG" shorts).
4. Real-Time Dashboard
A built-in HUD (Heads-Up Display) in the top-right corner monitors the Cycle Power and explicitly labels the current market phase, so you never have to guess where you are in the "Distorted Cycle."
---
How to Trade with Wave Navigator
1. Identify the Zone: Look for the Sine Wave to enter the "Preparation" (Low) or "Distribution" (High) zones.
2. Wait for the Sweep: Look for a Liquidity Sweep icon to appear at the cycle extremes.
3. Confirm with Displacement: Wait for a Displacement Arrow and a coloured Sine Wave flip (Green for Up / Red for Down).
4. The Entry: Enter on the Retrace to FVG (the coloured boxes) once the wave has begun its new direction.
Settings
- Base MA Length: Adjust this to change the "frequency" of the wave (Higher = Swing Trading, Lower = Scalping).
- Displacement Sensitivity: Fine-tune how "aggressive" the price move must be to trigger an FVG.
- Sine Opacity: Customise the visual intensity of the trend wave.
Disclaimer: Trading involves significant risk. This indicator is a tool for analysis and should be used in conjunction with a robust trading plan and proper risk management.
(Updated visual presentation) Индикатор

Meridian Imbalance Ledger [JOAT]Meridian Imbalance Ledger
Introduction
Meridian Imbalance Ledger is an open-source imbalance mapping tool that tracks confirmed chart-timeframe, higher-timeframe, and micro-structure fair value gaps inside one coordinated framework. The script is designed to answer three practical questions: where imbalance was created, whether that imbalance is still active, and how price is behaving when it returns to those zones.
The indicator solves a context problem. Many imbalance tools only mark a gap once and leave the trader to manually judge whether it remains relevant. Meridian instead maintains a living ledger of active zones, inversion status, fill progress, age, and structural pressure so the chart shows which imbalances still matter and which ones have been consumed.
Core Concepts
1. Multi-source imbalance detection
Meridian separates imbalance generation into three sources:
Chart timeframe imbalances
Higher-timeframe imbalances requested with non-repainting offset logic
Optional micro-structure imbalance scans from lower-timeframe data
This allows a trader to see whether current price is interacting with local inefficiency, inherited higher-timeframe inefficiency, or smaller sub-bar displacement inside the current bar structure.
2. Fill progress and retirement logic
Each zone remains active until its fill rule is satisfied. The script supports configurable retirement behavior so zones can be treated as mitigated on a simple touch, midpoint interaction, or deeper body-based invalidation depending on the chosen rule set.
3. Inversion tracking
If price meaningfully breaches an imbalance, the zone can be treated as structurally altered rather than simply forgotten. Meridian keeps inversion state so prior bullish inefficiency can become resistance context and prior bearish inefficiency can become support context.
4. Age and pressure weighting
Not all zones deserve equal weight. Meridian tracks zone age and active count to create a pressure ratio that helps communicate whether bullish or bearish imbalance structure is dominating the chart right now.
Features
Chart, HTF, and micro imbalance layers: Multiple imbalance sources displayed in one coordinated ledger
Non-repainting HTF requests: Higher-timeframe data requested using historical offsets for safer confirmed context
Fill-progress tracking: Zones remain active until their configured retirement condition is met
Inversion state handling: Breached imbalances can remain visible as flipped structural context
Age-aware zone fading: Older zones visually decay to reduce clutter while retaining context
Pressure ratio and active counts: Quick read on whether bullish or bearish imbalance pressure is leading
Compact top-right dashboard: Displays counts, inversion totals, micro scan status, and bias ratio
Confirmed-bar alerts: New imbalance, inversion, and state transitions only trigger on confirmed bars
How to Use This Indicator
Step 1: Identify whether current price is trading inside fresh chart-timeframe imbalance or approaching older inherited imbalance from a higher timeframe.
Step 2: Use the dashboard counts and bias ratio to judge whether current imbalance structure is skewed toward support or resistance.
Step 3: Monitor inversion states. A previously bullish zone that has failed cleanly may become useful resistance context on retests.
Step 4: Treat micro imbalance scans as execution detail, not a standalone trend signal. The broader chart and HTF layers should carry more decision weight.
Limitations
Micro-structure scans depend on lower-timeframe availability and plan limits
HTF imbalances are intentionally delayed by one completed HTF bar to reduce repaint risk
An imbalance zone is contextual, not a guarantee of reversal or continuation
Originality Statement
Meridian Imbalance Ledger is original in the way it combines confirmed chart imbalances, non-repainting higher-timeframe imbalance inheritance, optional micro scans, and zone lifecycle management into one stateful framework. The script is intended as a structured market context layer, not a one-click entry signal.
Disclaimer
This indicator is provided for educational and informational purposes only. It does not provide financial advice or trade recommendations. Imbalance reactions can fail, invert, or be ignored entirely by the market. Always use independent confirmation and risk management.
Индикатор

Индикатор

Cody Zig ZagCody Zig Zag Indicator - Complete Explanation
This is a Zig Zag indicator that replicates the MetaTrader 4 (MT4) version, which works differently than TradingView's built-in Zig Zag. Here's what it does:
🎯 What is a Zig Zag Indicator?
It filters out minor price movements to show only significant swing highs and swing lows, helping you identify trends and chart patterns (head & shoulders, double tops/bottoms, etc.).
⚙️ User Settings (Inputs)
Setting Default What It Does
Depth 6 Lookback period to find local highs/lows
Deviation 5 Minimum price change (in ticks) to form a new swing point
Backstep 2 Minimum bars between swing points
Line Thickness 2 Zig Zag line width
Bull Color Lime Color for upward moves
Bear Color Red Color for downward moves
Repaint Levels true If ON, lines/labels adjust real-time; if OFF, they lock on close
🔍 How It Works (The "Bake" Section)
Step 1: Find Potential Pivot Points
p_lw = Most recent low within Depth bars
p_hg = Most recent high within Depth bars
Checks if price moved enough (Deviation * tick size) to qualify
Step 2: Determine Direction
down = Boolean (true = bearish/downward leg, false = bullish/upward leg)
Tracks whether we're connecting a high→low (down) or low→high (up)
Step 3: Draw Zig Zag Lines
Connects alternating swing highs and swing lows
Labels each point as:
HH = Higher High
LH = Lower High
LL = Lower Low
HL = Higher Low
🏷️ Labels Explained
When price makes a new swing point, you'll see:
HH (Higher High) - Bullish continuation signal
LH (Lower High) - Bearish reversal signal
LL (Lower Low) - Bearish continuation signal
HL (Higher Low) - Bullish reversal signal
📊 Visual Features
Colored Zig Zag lines: Green for up-legs, Red for down-legs
Background color: Green during bullish legs, Red during bearish legs (90% transparent)
Labels: Tiny triangles pointing up/down with text
⚠️ Repaint Behavior (Important!)
Repaint = ON (default) Repaint = OFF
Lines/labels update in real-time Locks on bar close
Can "repaint" history More reliable for backtesting
Good for real-time trading No historical repainting
Warning: Zig Zag indicators naturally repaint because they need future bars to confirm pivot points. The repaint option controls HOW they repaint.
🚨 Alerts
This script triggers alerts when:
Direction Changed - Zig Zag switches from up to down or down to up
Bullish Direction - Switches from down to up
Bearish Direction - Switches from up to down
📈 How to Use
Identify Trend: Upward Zig Zag = Uptrend; Downward = Downtrend
Find Patterns: Look for HH/HL patterns (bullish) or LH/LL patterns (bearish)
Divergence: Compare Zig Zag swings with oscillator indicators
Support/Resistance: Swing points act as natural S/R levels
⚡ Quick Summary
This indicator draws a line connecting significant price swings, ignoring small noise. It's great for:
Visualizing trend structure
Identifying chart patterns
Finding entry/exit levels
Spotting trend reversals Индикатор