Signal Qualification Engine [JOAT]Signal Qualification Engine
Introduction
The Signal Qualification Engine is a sophisticated multi-layer signal filtering system designed to identify high-probability trading opportunities through comprehensive confluence analysis. This indicator solves the universal trading problem of signal quality - not all signals are created equal, and distinguishing between mediocre setups and high-probability opportunities is what separates successful traders from the crowd. By evaluating signals across trend, momentum, volume, and structure layers, this engine provides institutional-grade signal qualification that helps traders focus only on the best opportunities.
This tool is built for traders who understand that edge in trading comes from the confluence of multiple factors rather than any single indicator. Whether you're a discretionary trader looking for confirmation, a systematic trader needing signal filtering, or an algorithm developer requiring quality scoring, this engine provides the comprehensive analysis needed to elevate your trading from random signals to systematic, high-quality setups.
Why This Indicator Exists
Most traders struggle with signal overload - too many signals, varying quality, and no systematic way to evaluate them. This indicator addresses that critical problem by:
Multi-Layer Analysis: Evaluates signals across four independent analytical layers
Quality Scoring: Provides objective, numerical quality scores for every signal
Confluence Detection: Identifies when multiple factors align for high-probability setups
Risk/Reward Validation: Ensures signals offer adequate profit potential relative to risk
Premium Signals: Flags exceptional setups with maximum confluence
Visual Zones: Shows entry zones, stop levels, and targets for clear risk management
The engine transforms subjective signal evaluation into an objective, systematic process that can be consistently applied across all market conditions and instruments.
Core Components Explained
1. Trend Analysis Layer
The trend layer evaluates the directional bias using multiple trend indicators:
// Trend scoring
int trend_bull_score = 0
int trend_bear_score = 0
// Moving average analysis
if price_above_fast_ma
trend_bull_score += 1
if price_above_slow_ma
trend_bull_score += 1
if ma_bullish_cross
trend_bull_score += 1
// ADX analysis
if adx > i_adx_thresh
trend_bull_score += plus_di > minus_di ? 2 : 0
trend_bear_score += minus_di > plus_di ? 2 : 0
Trend components:
Price vs MAs: Position relative to fast and slow moving averages
MA Crossovers: Recent trend changes and confirmation
ADX Strength: Trend strength above threshold (default 25)
Directional Movement: +DI vs -DI for trend direction
Trend Score: Cumulative trend strength (0-5 points)
The trend layer ensures we only trade in the direction of the established trend or during trend changes with confirmation.
2. Momentum Analysis Layer
Momentum is evaluated through multiple oscillators to ensure optimal timing:
// Momentum scoring
int momentum_bull_score = 0
int momentum_bear_score = 0
// RSI analysis
if rsi > 50 and rsi < 70 and rsi > rsi
momentum_bull_score += 1
if rsi < 50 and rsi > 30 and rsi < rsi
momentum_bear_score += 1
// Stochastic analysis
if stoch_k > stoch_d and stoch_k < 80
momentum_bull_score += 1
if stoch_k < stoch_d and stoch_k > 20
momentum_bear_score += 1
// MACD analysis
if macd_hist > 0 and macd_hist > macd_hist
momentum_bull_score += 1
if macd_hist < 0 and macd_hist < macd_hist
momentum_bear_score += 1
Momentum components:
RSI Direction: Momentum direction with overbought/oversold filters
Stochastic Crossovers: Entry timing with extreme level avoidance
MACD Histogram: Trend acceleration and deceleration
Momentum Score: Cumulative momentum strength (0-3 points)
Divergence Detection: Price/momentum divergences for early signals
The momentum layer ensures we enter when momentum supports our directional bias.
3. Volume Analysis Layer
Volume confirms the strength and conviction behind price movements:
// Volume analysis
float vol_sma = ta.sma(volume, 20)
float vol_ratio = vol_sma > 0 ? volume / vol_sma : 1.0
bool above_avg_vol = volume > vol_sma * 1.2
bool high_vol_session = session_vol_ratio > 1.5
// Volume scoring
int volume_score = 0
if above_avg_vol
volume_score += 1
if high_vol_session
volume_score += 1
if vol_ratio > 1.5
volume_score += 1
Volume components:
Volume Ratio: Current volume relative to 20-period average
Above Average Volume: Confirms signal strength (20% above average)
Session Volume Analysis: Compares current volume to historical session averages
Volume Score: Cumulative volume confirmation (0-3 points)
Volume Spike Detection: Exceptional volume that may signal institutional activity
The volume layer ensures signals have sufficient participation to be reliable.
4. Structure Analysis Layer
Structure identifies key levels where professional traders place orders:
// Structure analysis
float swing_high = ta.pivothigh(high, i_swing_left, i_swing_right)
float swing_low = ta.pivotlow(low, i_swing_left, i_swing_right)
bool near_resistance = math.abs(close - nearest_resistance) / close * 100 < i_level_proximity
bool near_support = math.abs(close - nearest_support) / close * 100 < i_level_proximity
bool sweep_high = high > nearest_resistance and close < nearest_resistance
bool sweep_low = low < nearest_support and close > nearest_support
Structure components:
Swing Points: Key highs and lows defining market structure
Level Proximity: Distance to nearest support/resistance
Liquidity Sweeps: Price moves beyond levels that quickly reverse
Break of Structure: Confirms trend changes
Structure Score: Cumulative structural confirmation (0-3 points)
The structure layer ensures entries occur at technically significant levels.
5. Signal Qualification System
All layers combine to produce a comprehensive qualification score:
// Total scores (max 14)
int bull_total = (
trend_bull_score + momentum_bull_score + volume_score + structure_score +
(near_support ? 1 : 0) + (sweep_low ? 1 : 0) + (rr_ratio >= i_min_rr ? 1 : 0)
)
int bear_total = (
trend_bear_score + momentum_bear_score + volume_score + structure_score +
(near_resistance ? 1 : 0) + (sweep_high ? 1 : 0) + (rr_ratio >= i_min_rr ? 1 : 0)
)
Qualification criteria:
Trend Score (0-5 points): Directional bias strength
Momentum Score (0-3 points): Timing confirmation
Volume Score (0-3 points): Participation confirmation
Structure Score (0-3 points): Level confirmation
Level Proximity (1 point): Entry at key level
Liquidity Sweep (1 point): Institutional activity
Risk/Reward (1 point): Adequate profit potential
Maximum Score: 14 points for perfect confluence
6. Quality Grading System
Signals are graded based on their qualification score:
// Quality grades
string bull_grade = bull_total >= 12 ? "A+" :
bull_total >= 10 ? "A" :
bull_total >= 8 ? "B" :
bull_total >= 6 ? "C" : "D"
string bear_grade = bear_total >= 12 ? "A+" :
bear_total >= 10 ? "A" :
bear_total >= 8 ? "B" :
bear_total >= 6 ? "C" : "D"
Grade meanings:
A+ (12-14 points): Exceptional setup with maximum confluence
A (10-11 points): High-quality setup with strong confluence
B (8-9 points): Good setup with moderate confluence
C (6-7 points): Acceptable setup with basic confluence
D (0-5 points): Weak setup, avoid trading
Only B-grade and above signals are typically considered for trading.
7. Risk/Reward Validation
Each signal is validated for adequate profit potential:
// Risk/Reward calculation
float atr_val = ta.atr(14)
float stop_distance = atr_val * i_stop_mult
float target_distance = atr_val * i_target_mult
float rr_ratio = target_distance / stop_distance
// RR validation
bool valid_rr = rr_ratio >= i_min_rr
RR features:
ATR-Based Stops: Dynamic stop placement based on volatility
Multiple Targets: Primary and secondary profit targets
Minimum RR Ratio: Configurable minimum (default 1.5:1)
RR Validation: Signals without adequate RR are disqualified
Visual Targets: Clear stop and target levels on chart
Visual Elements
Signal Markers: Clear entry signals with quality grades
Entry Zones: Shaded areas showing optimal entry regions
Risk Levels: Visual stop loss and target levels
Quality Meter: Real-time confluence score display
Background Colors: Signal strength background shading
Dashboard: Comprehensive metrics panel
Premium Signals: Special markers for A+ grade setups
The dashboard displays:
1. Current signal qualification scores
2. Quality grades and confluence percentages
3. Individual layer scores (trend, momentum, volume, structure)
4. Risk/Reward ratio and validation status
5. Nearest support/resistance levels
6. Volume analysis and session context
7. Signal cooldown status
8. Premium signal indicators
Input Parameters
Trend Settings:
Fast MA Period: Short-term trend (default: 21)
Slow MA Period: Medium-term trend (default: 55)
ADX Period: Trend strength (default: 14)
ADX Threshold: Minimum trend strength (default: 25)
Momentum Settings:
RSI Period: Momentum oscillator (default: 14)
Stochastic K/D: Entry timing (default: 14/3)
MACD Fast/Slow/Signal: Trend acceleration (default: 12/26/9)
Structure Settings:
Swing Left/Right: Pivot point detection (default: 10/5)
Level Proximity %: Distance to key levels (default: 0.5%)
Max Levels: Maximum swing levels to track (default: 20)
Qualification Settings:
Minimum Score: Required qualification score (default: 6)
Signal Cooldown: Bars between signals (default: 5)
Minimum R:R: Required risk/reward ratio (default: 1.5)
Require Confirmation: Wait for bar close (default: true)
How to Use This Indicator
Step 1: Monitor Signal Quality
Watch for B-grade or higher signals. A-grade signals offer the highest probability but occur less frequently. Focus on quality over quantity - one A-grade signal is worth ten C-grade signals.
Step 2: Verify Layer Alignment
Check the dashboard to see which layers are contributing to the signal. The best signals have confirmation from all four layers (trend, momentum, volume, structure).
Step 3: Assess Risk/Reward
Ensure the signal offers adequate profit potential. The indicator automatically validates RR ratios, but you should manually verify that targets make sense in the current market context.
Step 4: Time Entry with Structure
Use the entry zones and structure levels to time your entry precisely. The best entries occur when price is near key support/resistance levels or after liquidity sweeps.
Step 5: Manage Risk Dynamically
Use the visual stop and target levels as guidelines, but adjust based on your personal risk tolerance and account size. Never risk more than you're comfortable losing.
Step 6: Track Premium Signals
Pay special attention to A+ grade premium signals. These rare setups with maximum confluence often lead to the largest moves and deserve larger position sizes.
Best Practices
Be patient for A-grade signals rather than forcing mediocre trades
Use the qualification score as your primary filter - ignore signals below your minimum threshold
Combine with your own analysis for additional confirmation
Adjust the minimum score based on market conditions - higher in choppy markets, lower in strong trends
Keep a trade journal to track which grade performs best in each market condition
Use the cooldown period to avoid overtrading - quality signals require patience
Pay attention to volume confirmation - signals without volume support often fail
Structure is key - signals at major levels have higher success rates
Liquidity sweeps provide high-probatility reversal opportunities
Always respect the risk/reward validation - poor RR setups destroy accounts
Strategy Integration
This indicator is designed to enhance any trading system:
Use as a signal filter for existing strategies
Import quality scores to weight trade decisions
Combine with trend-following systems for entry timing
Use structure levels for stop placement in other systems
Integrate volume analysis for signal confirmation
Apply risk/reward validation to all trades
Use premium signals as standalone trade opportunities
Export layer scores for custom signal development
The indicator includes 12 export functions for integration:
Bull/Bear Score Export: Total qualification scores
Quality Grade Export: Letter grade as numeric value
Trend Score Export: Trend layer score
Momentum Score Export: Momentum layer score
Volume Score Export: Volume layer score
Structure Score Export: Structure layer score
RR Ratio Export: Current risk/reward ratio
Signal Export: Binary signal output
Premium Signal Export: A+ grade signal flag
Technical Implementation
Built with Pine Script v6 featuring:
Multi-layer signal analysis across four independent systems
Dynamic qualification scoring with configurable weights
Advanced market structure detection with pivot points
Volume analysis with session context
Risk/reward validation with ATR-based calculations
Comprehensive visualization with entry zones and risk levels
Real-time dashboard with 12 key metrics
Alert conditions for all signal types and grades
Export functions for strategy integration
Premium signal detection for exceptional setups
The code uses confirmed bars for all calculations to prevent repainting and ensure reliable signals.
Originality Statement
This indicator is original in its comprehensive approach to signal qualification and multi-layer confluence analysis. While individual components (RSI, MACD, ADX, etc.) are established tools, this indicator is justified because:
It synthesizes four distinct analytical layers into a unified qualification system
The scoring system provides objective, numerical signal evaluation
Quality grading transforms subjective analysis into systematic decision-making
Risk/reward validation ensures only profitable setups are considered
Structure analysis integration provides context for market microstructure
Volume layer adds confirmation often missing from signal systems
Premium signal detection identifies exceptional opportunities
Comprehensive visualization makes complex analysis accessible
Export functions enable integration with any trading system
Each layer contributes unique insights: trend provides direction, momentum provides timing, volume provides confirmation, and structure provides context
The indicator's value lies in transforming signal evaluation from art to science - providing traders with a systematic, objective way to identify and focus only on the highest probability trading opportunities.
Disclaimer
This indicator is provided for educational and informational purposes only. It is not financial advice or a recommendation to buy or sell any financial instrument. Signal qualification is a tool for improving trade selection, not a guarantee of success.
Even high-quality signals can fail due to unexpected market events, news, or changes in market conditions. Past performance of high-grade signals does not guarantee future results. The indicator's signals are mathematical calculations based on historical patterns and should be used in conjunction with proper risk management.
Always use stop losses and position sizing appropriate for your account size and risk tolerance. Never risk more than you can afford to lose on any single trade, regardless of signal quality.
The author is not responsible for any losses incurred from using this indicator. Users assume full responsibility for all trading decisions made using this system.
-Made with passion by officialjackofalltrades
Индикатор

Momentum Pressure Gauge [JOAT] Momentum Pressure Gauge
Introduction
The Momentum Pressure Gauge is an advanced institutional-grade analysis tool designed to measure the underlying buying and selling pressure that drives market movements. This indicator goes beyond simple momentum oscillators by quantifying the actual pressure differential between buyers and sellers, incorporating volume analysis, detecting divergences, and identifying when momentum is reaching extreme levels. Understanding pressure and momentum is crucial because price often follows pressure - by measuring the force behind price movements, traders can anticipate future direction with greater confidence.
This tool is built for traders who understand that markets are driven by the constant battle between buyers and sellers, and that the outcome of this battle is reflected in pressure and momentum patterns. Whether you're a day trader timing entries with precision, a swing trader identifying trend strength, or a position trader spotting major reversals, this gauge provides the sophisticated pressure analysis needed to trade with the dominant force rather than against it.
Why This Indicator Exists
Most traders use basic momentum indicators without understanding the underlying pressure dynamics or volume participation. This indicator addresses that limitation by:
Pressure Analysis: Measures actual buying/selling pressure in each bar
Volume Weighting: Incorporates volume to confirm pressure significance
Momentum Scoring: Provides composite momentum scores with multiple factors
Divergence Detection: Identifies price/momentum divergences for early reversal signals
Extreme Zone Identification: Flags overbought/oversold conditions with pressure context
Energy Wave Analysis: Combines pressure with volume and price energy
The gauge transforms abstract momentum concepts into concrete pressure measurements that reveal the true force behind market movements.
Core Components Explained
1. Raw Pressure Calculation
The indicator measures buying and selling pressure in each bar:
// Raw buying/selling pressure
f_pressure_raw() =>
float range_val = high - low
float buy_pressure = range_val > 0 ? (close - low) / range_val : 0.5
float sell_pressure = range_val > 0 ? (high - close) / range_val : 0.5
// Apply smoothing
float pressure_ratio = ta.ema(raw_buy, i_pressure_len)
float pressure_smooth = ta.ema(pressure_ratio, i_smooth_len)
Pressure components:
Buy Pressure: Where price closed within the bar's range (0-1)
Sell Pressure: Complementary sell pressure (0-1)
Pressure Ratio: Buy pressure as a ratio
Smoothing: EMA smoothing for cleaner signals
Range Normalization: Pressure relative to bar's range
Pressure above 0.5 indicates buying dominance, below 0.5 indicates selling dominance.
2. Volume-Weighted Pressure
Volume analysis confirms the significance of pressure:
// Volume relative strength
float vol_sma = ta.sma(volume, i_pressure_len)
float vol_ratio = vol_sma > 0 ? volume / vol_sma : 1.0
float vol_weight = math.min(vol_ratio, 3.0) / 3.0 // Cap at 3x average
// Volume-weighted pressure
float vw_pressure = pressure_smooth * (0.7 + vol_weight * 0.3)
// Cumulative pressure
float cum_pressure = ta.sma(raw_buy, i_pressure_len) - 0.5 // Centered at 0
Volume features:
Volume Ratio: Current volume relative to average
Volume Weight: Normalized volume influence (0-1)
VW Pressure: Pressure adjusted for volume participation
Cumulative Pressure: Running pressure average
Volume Cap: Prevents extreme volume from distorting signals
High volume confirms pressure significance, while low volume questions its reliability.
3. Momentum Analysis
Multiple momentum factors are combined for comprehensive analysis:
// Pressure momentum (rate of change)
float pressure_momentum = pressure_smooth - pressure_smooth
// Pressure acceleration
float pressure_accel = pressure_momentum - pressure_momentum
// Composite pressure score (-100 to +100)
float composite_score = (pressure_smooth - 0.5) * 200
// Momentum-adjusted score
float momentum_adjustment = pressure_momentum * 100
float adjusted_score = composite_score + momentum_adjustment * 0.3
Momentum components:
Pressure Momentum: Rate of change in pressure
Pressure Acceleration: Change in momentum (second derivative)
Composite Score: Normalized pressure score (-100 to +100)
Momentum Adjustment: Score adjusted for momentum
Acceleration Detection: Identifies momentum shifts
Momentum analysis reveals not just current pressure but its direction and acceleration.
4. WaveTrend Integration
The WaveTrend oscillator adds an additional momentum layer:
f_wavetrend(int channel_len, int avg_len) =>
float ap = hlc3
float esa = ta.ema(ap, channel_len)
float d = ta.ema(math.abs(ap - esa), channel_len)
float ci = d > 0 ? (ap - esa) / (0.015 * d) : 0.0
float wt1_local = ta.ema(ci, avg_len)
float wt2_local = ta.sma(wt1_local, 4)
// WaveTrend signals
bool wt_bullish = wt1 > wt2 and wt1 > wt1
bool wt_bearish = wt1 < wt2 and wt1 < wt1
bool wt_oversold = wt1 < -60
bool wt_overbought = wt1 > 60
WaveTrend features:
WT1/WT2 Lines: Fast and slow WaveTrend lines
Cross Signals: Line crossovers for momentum changes
Extreme Levels: Overbought (>60) and oversold (<-60)
Trend Confirmation: Line slope for additional confirmation
Integration: Combined with pressure for confluence
WaveTrend provides an independent momentum confirmation.
5. Energy Wave Calculation
The indicator combines multiple energy sources:
// Energy combines pressure momentum with volume energy
float vol_energy = vol_sma > 0 ? (volume - vol_sma) / vol_sma * 100 : 0
float atr_14 = ta.atr(14)
float price_energy = atr_14 > 0 ? (close - open) / atr_14 * 100 : 0
float combined_energy = (pressure_momentum * 100 + vol_energy * 0.3 +
price_energy * 0.2) / 1.5
float energy_smooth = ta.ema(combined_energy, 5)
Energy components:
Volume Energy: Volume deviation from average
Price Energy: Price movement relative to ATR
Pressure Energy: Momentum contribution
Combined Energy: Weighted average of all energies
Energy Smoothing: EMA for cleaner energy signals
Energy waves show the underlying power driving market movements.
6. Divergence Detection
The indicator identifies price/momentum divergences:
// Price direction
float price_change = close - close
int price_dir = price_change > 0 ? 1 : price_change < 0 ? -1 : 0
// Pressure direction
int pressure_dir = pressure_momentum > i_momentum_thresh ? 1 :
pressure_momentum < -i_momentum_thresh ? -1 : 0
// Divergence detection
bool bullish_divergence = price_dir == -1 and pressure_dir == 1
bool bearish_divergence = price_dir == 1 and pressure_dir == -1
Divergence types:
Bullish Divergence: Price falling but pressure rising
Bearish Divergence: Price rising but pressure falling
Hidden Divergence: Continuation patterns
Regular Divergence: Reversal patterns
Threshold Filter: Minimum momentum for valid divergence
Divergences often precede significant price reversals.
7. State Classification System
The indicator classifies market states based on pressure:
// Pressure state
// 2 = extreme buying, 1 = buying, 0 = neutral, -1 = selling, -2 = extreme selling
var int pressure_state = 0
if pressure_smooth >= i_extreme_high
pressure_state := 2
else if pressure_smooth > 0.5 + i_momentum_thresh
pressure_state := 1
else if pressure_smooth <= i_extreme_low
pressure_state := -2
else if pressure_smooth < 0.5 - i_momentum_thresh
pressure_state := -1
// Momentum state
// 1 = accelerating, 0 = steady, -1 = decelerating
var int momentum_state = 0
if pressure_accel > i_momentum_thresh / 2
momentum_state := 1
else if pressure_accel < -i_momentum_thresh / 2
momentum_state := -1
State meanings:
Extreme Buying: Maximum buying pressure (>70%)
Buying: Moderate buying pressure (50-70%)
Neutral: Balanced pressure (40-60%)
Selling: Moderate selling pressure (30-50%)
Extreme Selling: Maximum selling pressure (<30%)
Accelerating: Momentum increasing
Decelerating: Momentum decreasing
State classification provides clear, actionable market conditions.
Visual Elements
Pressure Histogram: Main pressure display with gradient coloring
Multi-Layer Glow: Intensity-based glow effects
Energy Wave: Separate energy visualization
Momentum Line: Momentum rate of change
WaveTrend Lines: Additional momentum confirmation
Divergence Markers: Visual divergence signals
Extreme Zones: Highlighted overbought/oversold areas
Dashboard: Comprehensive metrics panel
Signal Labels: Key event labels with spacing
The dashboard displays:
1. Current pressure state and intensity
2. Momentum state and acceleration
3. Composite score and direction
4. Volume weight and analysis
5. Divergence status and alerts
6. Energy wave readings
7. Confluence quality score
8. WaveTrend status and signals
9. Overall signal strength
Input Parameters
Pressure Settings:
Pressure Period: Pressure calculation period (default: 14)
Smoothing Period: EMA smoothing (default: 5)
Momentum Lookback: Momentum calculation (default: 10)
Thresholds:
Extreme Buying: Maximum buying level (default: 0.7)
Extreme Selling: Maximum selling level (default: 0.3)
Momentum Threshold: Minimum momentum (default: 0.05)
WaveTrend Settings:
Channel Length: WT calculation period (default: 9)
Average Length: WT smoothing period (default: 12)
Enable WT: Toggle WaveTrend on/off
Visual Settings:
Color Scheme: Customizable pressure colors
Glow Effects: Enable visual enhancements
Show Zones: Display extreme zones
Show Labels: Control signal label frequency
How to Use This Indicator
Step 1: Assess Pressure State
Check the dashboard for current pressure state. Extreme states (>70% or <30%) often precede reversals, while moderate states suggest continuation.
Step 2: Analyze Momentum
Look at momentum direction and acceleration. Accelerating momentum in the pressure direction confirms strength, while deceleration warns of potential reversals.
Step 3: Check Volume Confirmation
Ensure pressure is supported by volume. High volume pressure is more reliable than low volume pressure.
Step 4: Watch for Divergences
Divergences are powerful reversal signals. A bullish divergence (price down, pressure up) suggests buying opportunity, while bearish divergence suggests selling.
Step 5: Monitor Energy Waves
Energy waves show the underlying power. Rising energy confirms current pressure, while falling energy suggests weakening.
Step 6: Use Extreme Zones
Extreme buying (>70%) often marks tops, while extreme selling (<30%) often marks bottoms. These are contrarian signals.
Best Practices
Extreme pressure states (>70% or <30%) often precede reversals
Divergences are most reliable at extreme levels
Volume confirmation is essential - pressure without volume is suspect
Momentum acceleration confirms pressure strength
Energy waves provide early warning of momentum shifts
Multiple timeframe analysis improves signal reliability
Combine with trend analysis for optimal results
Use WaveTrend crossovers for additional confirmation
Keep a pressure journal to track patterns
Be patient for the highest quality setups
Trading Applications
Momentum Trading:
Enter when pressure > 60% and accelerating
Add to positions as momentum increases
Exit when pressure decelerates or reverses
Use volume to confirm signal strength
Reversal Trading:
Look for extreme pressure (>70% or <30%)
Wait for divergence confirmation
Enter on first sign of pressure reversal
Target mean reversion to 50% level
Divergence Trading:
Identify clear price/pressure divergences
Confirm with volume and energy analysis
Enter on momentum shift confirmation
Use tight stops due to reversal nature
Strategy Integration
This indicator enhances any trading system:
Use pressure as a trend confirmation filter
Import momentum scores for signal weighting
Apply divergence detection for early warnings
Use extreme zones for contrarian signals
Integrate volume-weighted pressure for confirmation
Export pressure states for custom logic
Technical Implementation
Built with Pine Script v6 featuring:
Advanced pressure calculation with range normalization
Volume-weighted analysis with capping
Multi-factor momentum scoring system
WaveTrend oscillator integration
Energy wave calculation combining multiple sources
Sophisticated divergence detection with thresholds
State classification with multiple dimensions
Multi-layer visualization with glow effects
Real-time dashboard with 10 key metrics
Alert conditions for all major pressure events
The code uses confirmed bars for all calculations to prevent repainting.
Originality Statement
This indicator is original in its comprehensive approach to pressure and momentum analysis. While individual components (RSI, MACD, WaveTrend) are established tools, this indicator is justified because:
It synthesizes pressure analysis with volume weighting for more accurate signals
The energy wave concept combines multiple momentum sources into unified analysis
State classification provides clear, actionable market conditions
Divergence detection includes threshold filtering for higher quality signals
Multi-layer visualization with glow effects enhances readability
The dashboard presents complex pressure dynamics in an accessible format
Volume-weighted pressure adds confirmation often missing from momentum indicators
Acceleration analysis provides early warning of momentum shifts
Export functions enable integration with any trading system
Each component provides unique insights: pressure shows force, volume shows participation, momentum shows direction, energy shows power, and divergence shows potential reversals
The indicator's value lies in measuring the underlying forces that drive price movements rather than just tracking price itself, providing traders with deeper insight into market dynamics and potential future direction.
Disclaimer
This indicator is provided for educational and informational purposes only. It is not financial advice or a recommendation to buy or sell any financial instrument. Pressure and momentum analysis is a tool for understanding market forces, not a prediction system.
Pressure and momentum can change suddenly due to news events, economic data, or changes in market sentiment. Extreme pressure states can persist longer than expected, and divergences can fail without warning. The indicator's signals are mathematical calculations based on historical patterns and should be used in conjunction with other forms of analysis.
Always use proper risk management, including stop losses and position sizing appropriate for your account and risk tolerance. Never trade against strong pressure without confirmation - the trend can remain in force longer than your account can survive.
The author is not responsible for any losses incurred from using this indicator. Users assume full responsibility for all trading decisions made using this system.
-Made with passion by officialjackofalltrades
Индикатор

Индикатор

Goldilocks and the Three Bears - [Algoat_Alpha]Goldilocks and the Three Bears is a multi-layer confluence indicator that identifies
when three independent technical dimensions — trend, momentum, and direction — all
align in the same direction. Inspired by the classic fairy tale, it waits for
conditions that are "just right" before signaling.
━━━━━━━━━━━━━━━━━━━━━━━━━━━━━━━━━━
HOW IT WORKS
━━━━━━━━━━━━━━━━━━━━━━━━━━━━━━━━━━
The indicator evaluates three independent layers on every bar:
Papa (Trend) — A Moving Average (SMA or EMA) establishes the macro trend.
Price above the MA = bullish trend. Price below = bearish trend. This is the
slowest-moving component and acts as the structural filter.
Mama (Momentum) — The Relative Strength Index measures whether buying or selling
pressure dominates. RSI above the midline (default 50) = bullish momentum.
Below = bearish momentum. This prevents entries against exhausted moves.
Baby (Direction) — The MACD-Signal crossover captures the fastest directional
shift. MACD above its signal line = bullish direction. Below = bearish direction.
This is the trigger layer.
A signal fires only when ALL THREE flip into alignment simultaneously — the exact
bar where the last component joins the other two. This transition-based logic
prevents redundant signals during sustained trends.
━━━━━━━━━━━━━━━━━━━━━━━━━━━━━━━━━━
WHY CONFLUENCE MATTERS
━━━━━━━━━━━━━━━━━━━━━━━━━━━━━━━━━━
Each indicator alone produces frequent false signals:
• MA alone triggers late in ranges
• RSI alone triggers too early in trends
• MACD alone whipsaws in choppy markets
By requiring all three to agree, the indicator filters out noise that any single
layer would miss. The three layers operate on different mathematical principles
(price vs. average, momentum oscillator, moving average convergence/divergence),
so their agreement represents genuine multi-dimensional confluence — not just the
same signal measured three times.
━━━━━━━━━━━━━━━━━━━━━━━━━━━━━━━━━━
HOW TO USE
━━━━━━━━━━━━━━━━━━━━━━━━━━━━━━━━━━
1. Add the indicator to your chart. The dashboard shows the real-time state of
all three layers.
2. When all three show "Bull" → Goldilocks Zone (bullish). A 🐂 label appears
on the chart at the entry bar.
3. When all three show "Bear" → Goldilocks Zone (bearish). A 🐻 label appears.
4. "Still Cooking" means the layers are mixed — no directional consensus yet.
Hover over any signal label for a detailed tooltip showing the exact values
of all three components at the time of the signal.
━━━━━━━━━━━━━━━━━━━━━━━━━━━━━━━━━━
FEATURES
━━━━━━━━━━━━━━━━━━━━━━━━━━━━━━━━━━
• Auto light/dark theme detection — dashboard adapts to your chart background
• Discord-ready webhook alerts — alert messages are formatted as Discord embed
JSON, ready to pipe directly into a webhook channel
• Pine Screener compatible — includes Signal State, individual component states,
and a Bull Count (0-3) for flexible scanner filtering
• Minimal chart footprint — only the MA line and signal labels are drawn;
bar coloring is off by default
• Fully configurable — all indicator lengths, thresholds, dashboard position
and size are adjustable in settings
━━━━━━━━━━━━━━━━━━━━━━━━━━━━━━━━━━
ALERTS
━━━━━━━━━━━━━━━━━━━━━━━━━━━━━━━━━━
Three alert conditions are available:
• 3 Bulls Aligned (Long Entry)
• 3 Bears Aligned (Short Entry)
• Full Confluence (Any Direction)
All alert messages include ticker, timeframe, price, and component status.
Messages are pre-formatted as Discord webhook JSON — just paste your webhook
URL in TradingView's alert notification settings.
━━━━━━━━━━━━━━━━━━━━━━━━━━━━━━━━━━
PINE SCREENER
━━━━━━━━━━━━━━━━━━━━━━━━━━━━━━━━━━
Scanner columns exported:
• Signal State → 1 (bullish), -1 (bearish), 0 (no confluence)
• Papa Bull / Mama Bull / Baby Bull → individual component states (1 or 0)
• Bull Count → number of bullish layers (0 to 3), useful for "almost there" scans
━━━━━━━━━━━━━━━━━━━━━━━━━━━━━━━━━━
This indicator does not repaint and does not use request.security().
All calculations are performed on the current chart's timeframe.
Open source under MPL 2.0.
Stay Liquid. Индикатор

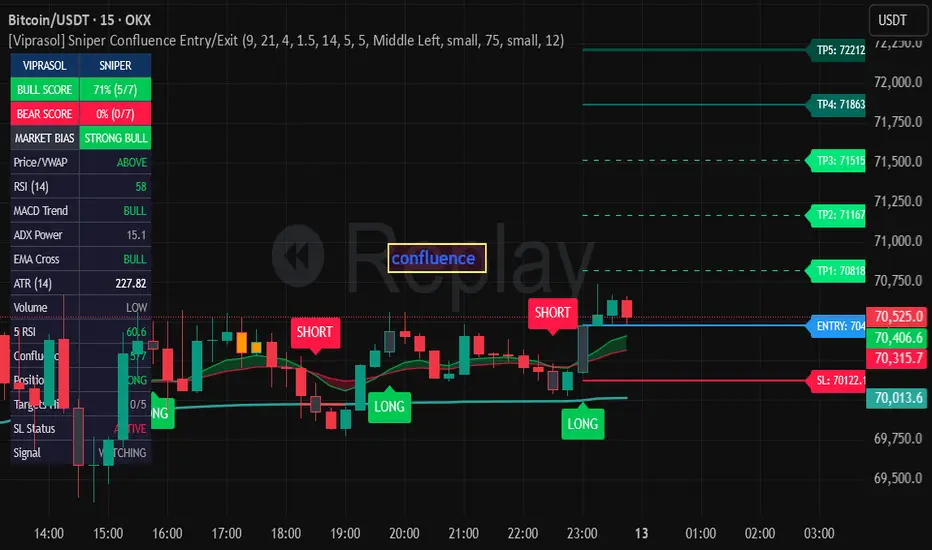
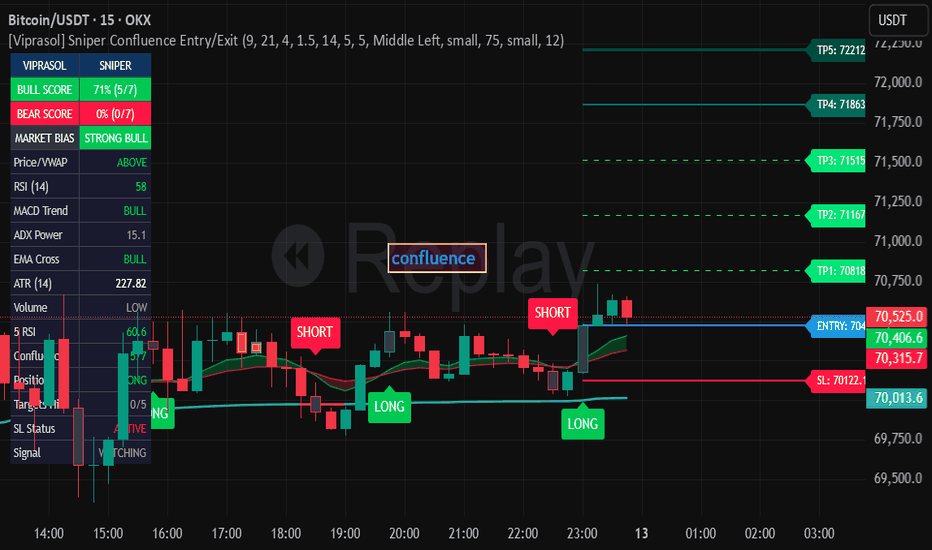
Viprasol Sniper Confluence Entry/Exit## Overview
The Sniper Confluence Entry/Exit indicator builds on Sniper Entry/Exit with SL&TP by , which provided EMA crossover signals with ATR-based stop-loss/take-profit levels, a VWAP overlay, RSI/MACD display, and retest candle highlighting. This version adds a 7-factor confluence scoring engine that gates every signal — crossovers only fire when multiple technical factors align, dramatically reducing false entries. Built for swing and intraday traders who want clean, high-probability setups with automatic risk management.
## How It Works
**Signal Generation (from original):**
Entries are triggered by a Fast EMA / Slow EMA crossover. When the fast EMA crosses above the slow EMA, a long signal is generated; when it crosses below, a short signal is generated. The original script displayed these crossovers alongside supporting indicators (VWAP, RSI, MACD) but did not require them to agree before firing a signal.
**7-Factor Confluence Engine (new):**
This version adds a scoring layer that sits between the crossover and the signal output. Each bar, the indicator evaluates 7 independent factors and assigns 1 point for each that confirms the trade direction. A signal only fires when the total score meets your minimum threshold (default: 4/7).
Scoring logic (pseudocode):
```
confluenceScore = 0
// Factor 1: Price vs VWAP
if (long and close > vwap) or (short and close < vwap) → score += 1
// Factor 2: RSI direction
if (long and rsi > 50) or (short and rsi < 50) → score += 1
// Factor 3: MACD trend
if (long and macdLine > signalLine) or (short and macdLine < signalLine) → score += 1
// Factor 4: EMA alignment
if (long and fastEMA > slowEMA) or (short and fastEMA < slowEMA) → score += 1
// Factor 5: ADX + directional index
if adx > 25 and ((long and diPlus > diMinus) or (short and diMinus > diPlus)) → score += 1
// Factor 6: Volume confirmation
if volume > volumeSMA and ((long and close > open) or (short and close < open)) → score += 1
// Factor 7: Secondary timeframe RSI
if (long and secondaryRSI > 50) or (short and secondaryRSI < 50) → score += 1
signal fires only if confluenceScore >= minimumScore
```
A score of 5/7 or higher typically indicates a strong, well-supported setup. The configurable minimum lets you tune signal frequency vs. quality.
**Bar-Close Confirmation (new):**
When enabled, signals are delayed until the bar closes, preventing premature entries from intra-bar wicks that reverse before close.
**ATR-Based Stop-Loss & Take-Profit (from original, extended):**
The original calculated a single stop-loss and take-profit from ATR. This version extends that to:
- **Stop-Loss** — ATR multiplied by your chosen risk factor (same core logic as original)
- **Take-Profit Levels (1-5)** — Configurable number of TP levels at 1R, 2R, 3R, 4R, 5R distances (new — original had fixed levels)
- **Trailing Stop to Breakeven** — Optionally moves SL to entry price once TP1 is hit (new)
**Retest Candle Highlighting (from original):**
Bars that pull back to the fast EMA after a signal are highlighted in orange, marking potential add-on or re-entry opportunities.
**Secondary Timeframe RSI (from original, extended):**
The original included a secondary timeframe RSI hardcoded to the 5-minute chart. This version makes the timeframe user-configurable.
## Key Features
**From the Original:**
- EMA crossover signal generation (fast/slow EMA)
- ATR-based stop-loss and take-profit calculation
- VWAP overlay with directional coloring
- RSI and MACD display
- Retest candle highlighting at EMA pullbacks
- Secondary timeframe RSI confirmation
**Added in This Version:**
- 7-factor confluence scoring engine with configurable minimum score threshold
- Bar-close confirmation filter to prevent wick-driven false entries
- Trailing stop-loss to breakeven after TP1 is hit
- Configurable number of take-profit levels (1-5, was fixed)
- Configurable secondary timeframe (was hardcoded to 5m)
- SL label showing breakeven status when trailing is active
- 5 alert conditions with dynamic messages
- Full dashboard showing all 7 confluence factors, position status, and targets hit
## How to Use
**Setup:**
1. Add to any chart (works on all markets and timeframes)
2. Set your preferred EMA periods (default: 9/21)
3. Adjust the minimum confluence score — higher = fewer signals, better quality
4. Set your ATR multiplier for stop-loss width
**Reading Signals:**
- **LONG label** appears below bar when bullish crossover fires with sufficient confluence
- **SHORT label** appears above bar when bearish crossover fires with sufficient confluence
- Blue line = Entry, Red line = Stop-Loss, Green dashed lines = Take-Profit levels
- Lines turn turquoise when their target is hit
- Orange candles indicate price retesting the fast EMA (potential add-on opportunity)
**Dashboard:**
The side panel shows real-time scores for all 7 factors plus current position info, targets hit, and SL status.
**Recommended Starting Settings:**
- Scalping (1m-5m): Fast EMA 5, Slow EMA 13, Min Score 5, ATR Mult 1.0
- Intraday (15m-1H): Fast EMA 9, Slow EMA 21, Min Score 4, ATR Mult 1.5
- Swing (4H-1D): Fast EMA 9, Slow EMA 21, Min Score 4, ATR Mult 2.0
## Settings
**Signal Settings:** Fast/Slow EMA periods and bar-close confirmation toggle.
**Confluence Filter:** Enable/disable the score filter and set the minimum threshold.
**Risk Management:** ATR period, SL multiplier, number of TP levels, and breakeven trailing toggle.
**Secondary Timeframe:** Choose which timeframe provides the secondary RSI confirmation.
**Dashboard:** Position, font size, and show/hide toggle.
**Visuals:** Toggle EMA ribbon, VWAP, TP/SL lines, retest highlighting, label sizes and offsets.
## Alerts
1. **Long Entry Signal** — Fires when a bullish confluence entry triggers
2. **Short Entry Signal** — Fires when a bearish confluence entry triggers
3. **Any Entry Signal** — Fires on either long or short entry
4. **Strong Bull Bias** — Fires when bull confluence score crosses above 70%
5. **Strong Bear Bias** — Fires when bear confluence score crosses above 70%
All alerts include {{ticker}}, {{close}}, and {{interval}} for dynamic notification messages.
## Limitations & Disclaimer
- EMA crossover signals are inherently lagging — they work best in trending markets and may produce whipsaws during consolidation
- The confluence score uses current-bar values; in fast markets, conditions can change quickly
- The secondary timeframe RSI uses `request.security()` which may repaint on the current bar of that timeframe
- TP/SL levels are visual guides — they do not execute trades automatically
- Past performance of any signal system does not guarantee future results
- This indicator is for educational and analytical purposes only — it is not financial advice. Always use proper risk management and do your own analysis before trading.
## Credits & Attribution
This indicator is derived from **"Sniper Entry/Exit with SL&TP (open-source, TradingView). The following components originate from that script:
- EMA crossover signal generation logic
- ATR-based stop-loss and take-profit calculation
- VWAP overlay
- RSI and MACD display
- Retest candle highlighting concept
- Secondary timeframe RSI (originally hardcoded to 5m)
Viprasol additions: 7-factor confluence scoring engine, bar-close confirmation, trailing stop to breakeven, configurable TP levels (1-5), configurable secondary timeframe, breakeven status labels, alert conditions, and dashboard.
Индикатор
Индикатор

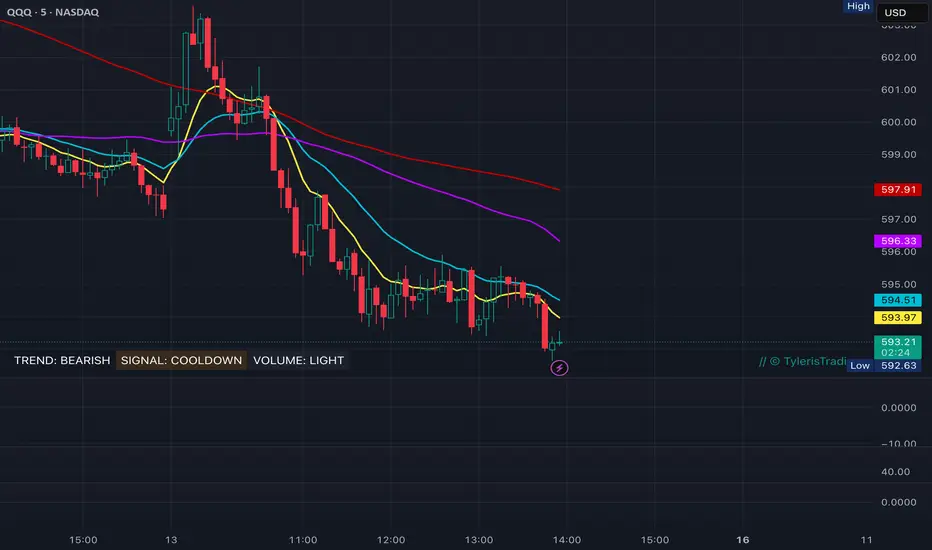
Squeeze/IntraDay ScalpsSqueeze / Intraday Scalps is a momentum-based intraday trading tool designed to help traders identify high-probability entry opportunities during strong directional moves. The indicator combines adjustable EMA crossover signals (5, 9, 21, and 34 are presets, but all customizable inputs) with higher-timeframe MAs (50 and 100 are preset, but can be adjusted as well as being EMAs or SMAs) and volume confirmation to filter out low-quality signals and highlight moments when momentum aligns with broader trend conditions.
Intended for intraday scalping and short-term options trading. The signals generated are dynamic, meaning a signal may trigger on the 5 minute chart, but not the 15M based on user-defined conditions; not meant to be a standalone entry signal, only used with other indicators for confirmation.
Customization Inputs:
• EMA and MA visibility
• MA types (EMA or SMA)
• Signal cooldown timing
• Label or triangle signal style
• Moving average colors
• Optional 50 and 100 MA structure filters
• Dashboard gradient strength
Dashboard provides a quick market readout of the following:
Trend – Bullish, Bearish, or Chop
Signal Status – Call, Put, Cooldown, or None
Volume Context – Supportive or Light
Gradient intensity reflects strength of the underlying condition, providing a visual gauge of momentum.
Signal Logic
Call Signals
A CALL signal is generated when:
• The 5 EMA crosses above the 9 EMA
• Price is trading above the 34 EMA
• The broader structure is bullish
• The cooldown timer allows a new signal (cooldown is also adjustable by minutes)
Put Signals
A PUT signal is generated when:
• The 5 EMA crosses below the 9 EMA
• Price is trading below the 34 EMA
• The broader structure is bearish
• The cooldown timer allows a new signal
Volume
Volume is compared to a 20-period average to determine whether market participation is strong enough to support the move.
The dashboard identifies when volume is:
• Supportive – momentum is likely sustainable
• Light – moves may lack conviction
Calculations and Best Uses
Signals generate following three passing conditions:
1. Momentum Trigger
• 5 EMA crossing above 9 EMA → Potential CALL signal
• 5 EMA crossing below 9 EMA → Potential PUT signal
This identifies when short-term momentum begins shifting.
2. Trend Structure Filter
Momentum signals are only triggered when the broader structure supports them. It evaluates:
• EMA 21 vs EMA 34 (core trend direction)
• Optional 50 MA (intermediate structure)
• Optional 100 MA (macro trend filter)
This prevents signals from firing against the general market direction.
3. Price Position Filter
Signals a call or put when previous two conditions are met and current price is trending:
• CALL signals require price above the 34 EMA
• PUT signals require price below the 34 EMA
This helps avoid entries in the middle of consolidation. However, given this is not always the case, the inputs are adjustable to allow traders to bypass this if they feel it's a good trade even if this final condition isn't met.
Author
© TylerisTrading Индикатор

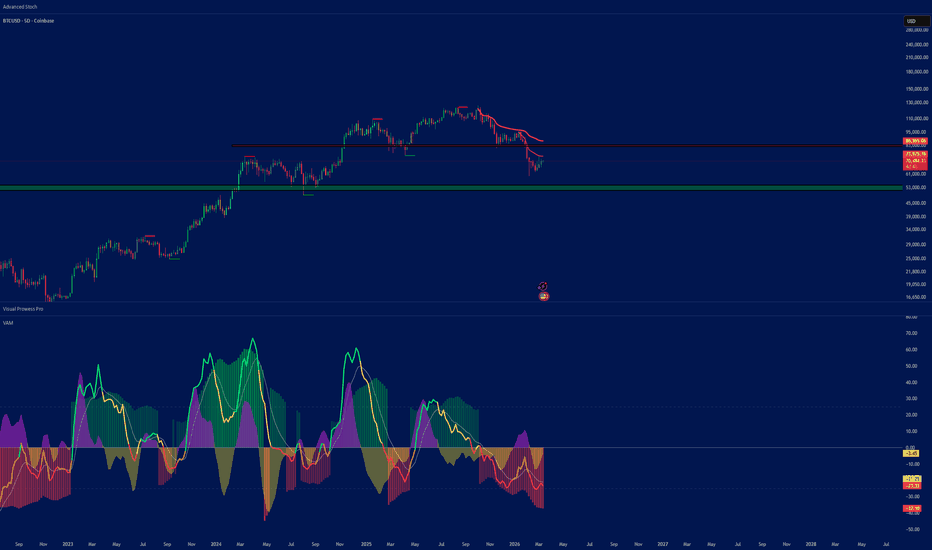
Velocity Acceleration Momentum [VAM]Velocity Acceleration Momentum
Overview
VAM is a multi-layered momentum indicator that measures how fast price is moving (Velocity), whether that speed is increasing or decreasing (Acceleration), and how strong the underlying trend is (ADX). Rather than just telling you the direction of price, VAM tells you the quality and phase of the move you're in.
How It's Calculated
Velocity measures the percentage rate of change of price over a lookback period (default: 14 bars), then smooths it with a 3-period EMA. It answers: "How fast is price moving relative to where it was?"
Acceleration is the change in Velocity over a secondary smoothing window (default: 5 bars), also EMA-smoothed. It answers: "Is momentum speeding up or slowing down?"
Signal Line is an EMA of Velocity (default: 9 bars) — similar in concept to the MACD signal line. When Velocity crosses above/below the Signal Line, it can indicate momentum shifts.
ADX Histogram uses Pine's built-in DMI/ADX calculation. When DI+ > DI−, bars plot positively (green); when DI− > DI+, bars plot negatively (red). The color opacity is gradient-mapped to ADX strength — vivid bars mean a strong trend, faded bars mean a weak/ranging market.
Reading the Velocity Line Colors (Regime Detection)
The Velocity line changes color based on the combination of Velocity and Acceleration:
ColorConditionMeaning🟢 LimeVelocity > 0, Acceleration > 0Rocket — momentum is up and accelerating🟡 YellowVelocity > 0, Acceleration < 0Topping — still positive but losing steam🔴 RedVelocity < 0, Acceleration < 0Freefall — momentum is down and worsening🟠 OrangeVelocity < 0, Acceleration > 0Bottoming — still negative but recovering
How to Trade With It
High level Buy when Velocity Line Green 🟢sell when Velocity drops hard and is Red 🔴
+
ADX BARS TELL YOU THE TREND AND THE TREND STRENTH (COMBINE THIS AND THE VELOCITY LINE)
+
ACCELERATION PUROPLE AND YELLOW WAVE TELLS YOU SHARP DROPS OR ADVANCES IN ACCELERATION
Trend Entries: Look for the Velocity line turning Lime (🟢) with the ADX histogram printing vivid green bars above the +25 line. This is the highest-confidence long setup — price is accelerating upward with confirmed trend strength.
Caution / Exit Signals: When Velocity turns Yellow (🟡) and sharply drops, momentum is fading even if price is still rising. Consider tightening stops or taking partial profits.
Short / Bearish Bias🔴 : Red Velocity + vivid red ADX bars below −25 signal a strong downtrend in Freefall. Avoid longs; look for short setups.
Potential Reversals: Orange Velocity (Bottoming) combined with ADX bars beginning to fade and shift green can be an early signal that a bottom is forming — useful for scaling into longs cautiously.
Signal Line Crosses: When the Velocity line crosses above the white Signal Line, momentum is picking up. Crosses below suggest weakening. Best used as a confirmation filter, not a standalone trigger.
The ±25 Reference Lines mark the ADX threshold commonly used to separate trending (above) from ranging (below) markets. ADX histogram bars inside the ±25 zone suggest low trend conviction — reduce position sizing or wait for confirmation.
Inputs
Source — Price input (default: Close)
Velocity Length — Lookback period for rate-of-change calculation (default: 14)
Acceleration Smooth — Smoothing window for acceleration (default: 5)
Signal Line Length — EMA period for the signal line (default: 9)
ADX Length — Period for DMI/ADX calculation (default: 14)
Show Signal Line — Toggle the white signal line on/off
Show Zone Backgrounds — Toggle ADX-strength background shading
Show ADX Histogram — Toggle the ADX directional histogram Индикатор
Squeeze Impulse OscillatorSqueeze Impulse Oscillator (SIO)
Indicator Description
The Squeeze Impulse Oscillator is designed to detect moments when the market exits a consolidation phase (squeeze) and forms a strong impulsive move. The indicator analyzes candlestick patterns, the ratio of the body to the range, wick lengths, and price dynamics to assess the strength of the current trend and potential breakout from consolidation.
The core idea is to compare two components:
Impulse – shows how strong the price movement is, based on the body size relative to the range and the persistence of direction (consecutive bars in the same direction).
Squeeze – reflects the degree of market tightness, evaluated by wick length and range contraction. Longer wicks and narrower ranges indicate higher energy accumulation for a subsequent impulse.
The resulting SIO value = impulse − squeeze. Positive values indicate a dominance of the impulse component, negative values point to a squeeze phase. Additional threshold levels help identify confident impulse zones and extreme squeeze zones.
How It Works
Candle Evaluation
Relative body size (bodyEff) – ratio of the candle body to its full range. Larger body means stronger impulse.
Wick ratio (wickRatio) – total wick length relative to the range. Long wicks indicate indecision or accumulation.
Current range compared to its average (rangeRatio) – helps incorporate volatility.
Price Dynamics
Persistence factor (persist) equals 1 if the last two price changes are in the same direction, otherwise 0.
Component Calculation
impulseScore = bodyEff × rangeRatio × (0.5 + 0.5 × persist)
squeezeScore = wickRatio × (2.0 − rangeRatio) × (1.0 − persist × 0.5)
Oscillator
rawSIO = impulseScore − squeezeScore
Final sio value is smoothed with an exponential moving average (EMA) using the specified smoothing period.
Squeeze Counter
When sio drops below the squeeze threshold (i_sqzTh), a consecutive bar count begins. The counter resets when sio rises above zero.
Additional Line
Averaged wick bias (avgWickBias) is displayed, showing which side has longer wicks (positive → bullish bias, negative → bearish bias). Used for signal filtering.
Signals
The indicator generates three types of signals (enabled via Show Signals parameter):
Bull Impulse – green triangle at the bottom.
Conditions:
sio crosses above the impulse threshold (i_impTh);
preceded by at least the minimum number of squeeze bars (Min Squeeze Bars);
wick bias positive (avgWickBias > 0).
Interpretation: after a prolonged squeeze phase, price starts moving up, confirmed by bullish candle structure.
Bear Impulse – red triangle at the bottom.
Same conditions but wick bias ≤ 0.
Interpretation: expected downward move after a squeeze.
Squeeze Start – purple diamond at the top.
Occurs when sio crosses below the squeeze threshold. Warns of possible energy accumulation and an upcoming impulse.
Visual Elements
SIO Histogram – colored according to the state:
bright green/red (depending on candle direction) – above impulse threshold;
purple – below squeeze threshold;
gray – neutral zone.
Wick Bias Line (yellow) – scaled for better visibility.
Squeeze Counter – purple step line showing consecutive bars in squeeze.
Background Highlight – squeeze zones are marked with a semi‑transparent purple background.
Horizontal Levels: impulse threshold, zero line, squeeze threshold.
Input Parameters
Core
Period – period for average range calculation and wick bias moving average.
Smoothing – EMA smoothing of the final SIO value.
Impulse Threshold – level above which the value is considered impulsive.
Squeeze Threshold – level below which the value is considered a squeeze.
Signals
Show Signals – enable/disable signal plotting.
Min Squeeze Bars – minimum number of consecutive squeeze bars required for an impulse signal.
Highlight Squeeze Zones – enable/disable background highlighting.
Colors – custom colors for all visual elements.
Usage
The indicator helps identify entry points after consolidation phases. Buy/sell signals should be considered only with confirming factors: higher‑timeframe trend, volume, support/resistance levels. False signals may occur in low‑volatility markets or during news events. It is recommended to backtest and adapt thresholds for the specific instrument.
Disclaimer
This indicator is not financial advice. All calculations are based on historical data and do not guarantee future results. Use it as one of many analytical tools in combination with other methods. Индикатор

Apex Momentum Wave [Pineify]Apex Momentum Wave
The Apex Momentum Wave (AMW) is a noise-filtered momentum oscillator that combines Hull Moving Average price smoothing with RSI momentum measurement and an EMA-based signal line to produce cleaner, more actionable momentum readings. Instead of applying RSI directly to raw price — which often generates noisy, whipsaw-prone signals — AMW first smooths the close price through an HMA filter to strip out short-term market noise, then measures momentum on this cleaned data. The result is a responsive yet smooth oscillator that highlights genuine momentum shifts while suppressing false signals. Buy and sell markers are further refined by a midline filter that only triggers entries when momentum is turning from a favorable position, making this indicator a practical tool for timing entries across any market and timeframe.
Key Features
HMA-smoothed RSI oscillator — applies RSI to a Hull Moving Average of price rather than raw close, dramatically reducing noise and false momentum readings.
EMA signal line with crossover detection — a trailing signal line provides clear, objective crossover-based entry triggers.
Midline-filtered buy/sell signals — BUY signals only fire when momentum crosses up below the 50 midline (turning from weakness), and SELL signals only fire when crossing down above 50 (turning from strength), filtering out low-conviction entries.
Multi-layer visual zone system — overbought/oversold zones, dynamic breach fills, and oscillator-signal cloud fills provide instant visual context of market momentum state.
Built-in alert conditions — configurable alerts for both BUY and SELL signals for hands-free monitoring.
How It Works
The indicator follows a three-stage calculation pipeline designed to extract clean momentum information from price:
Price smoothing via Hull Moving Average (HMA): The closing price is first passed through an HMA with a configurable period (default: 7). The Hull Moving Average uses a combination of weighted moving averages with a square-root-period final smoothing step, producing a curve that closely tracks price with significantly less lag than traditional SMA or EMA. This step acts as a pre-filter, removing intrabar noise and minor fluctuations before momentum is measured.
Momentum measurement via RSI: The Relative Strength Index is then calculated on the HMA-smoothed price over a configurable lookback (default: 14). Because the input price has already been cleaned by the HMA, the resulting RSI oscillator produces smoother momentum readings that more accurately reflect the underlying trend's strength, rather than reacting to every minor price tick.
Signal line via EMA: An Exponential Moving Average (default period: 9) is applied to the oscillator output, creating a trailing signal line. Crossovers between the oscillator and this signal line indicate momentum direction changes — the oscillator crossing above the signal suggests strengthening momentum, while crossing below suggests weakening momentum.
Trading Ideas and Insights
The AMW is designed to be versatile across different trading styles and market conditions. Here are practical approaches:
Momentum reversal entries: The primary use case — when a BUY triangle appears (oscillator crosses above signal below the 50 midline), it indicates momentum is shifting from bearish to bullish while still in the lower half of the range, catching the turn early. Enter long and target the midline or overbought zone. The SELL signal is the mirror for short entries.
Overbought/oversold confluence: When the oscillator enters the shaded overbought zone (above 80) or oversold zone (below 20), the market is at a momentum extreme. Wait for the oscillator to turn and cross below the signal line (in overbought) or above it (in oversold) for high-probability mean reversion trades.
Trend confirmation: Use the cloud fill between the oscillator and signal line as a trend filter. A sustained bullish (green) cloud suggests maintaining long bias; a sustained bearish (red) cloud suggests maintaining short bias. Only take signals aligned with the prevailing cloud color for higher win rates.
Divergence analysis: Compare the oscillator's peaks and troughs with price action. If price makes a higher high but the oscillator makes a lower high, bearish divergence suggests weakening momentum — and vice versa for bullish divergence. These divergences often precede significant reversals.
How Multiple Indicators Work Together
The AMW integrates three distinct technical components into a cohesive system, each serving a specific role:
Hull Moving Average (noise reduction): The HMA serves as the foundation layer, transforming noisy raw price data into a clean input signal. Its near-zero-lag property is critical — if a lagging average like SMA were used instead, the subsequent RSI calculation would inherit that lag, making the entire oscillator slow to react. HMA preserves responsiveness while eliminating the noise that causes false RSI signals.
Relative Strength Index (momentum quantification): RSI converts the smoothed price movement into a bounded 0–100 oscillator that measures the speed and magnitude of price changes. Applied to the HMA-filtered price, it produces a momentum reading that is both responsive and stable — capturing genuine momentum shifts without the jitter that plagues standard RSI on raw price.
Exponential Moving Average signal line (timing mechanism): The EMA of the oscillator creates a reference line that the oscillator oscillates around. Crossovers between the two provide objective, rule-based entry timing. The EMA's inherent smoothing prevents the signal line from reacting to every minor oscillator fluctuation, ensuring crossovers represent meaningful momentum changes rather than noise.
The synergy is sequential: HMA cleans the price → RSI measures momentum on clean data → EMA provides a timing reference for the momentum reading. Each layer builds on the previous one, and the midline filter on top adds a final directional bias check, ensuring the complete system produces signals only when multiple conditions align.
Unique Aspects
Pre-filtered RSI approach: Most oscillator indicators apply RSI (or similar) directly to raw price. AMW's innovation is the HMA pre-smoothing step, which fundamentally changes the quality of the RSI output. This two-stage approach produces a momentum oscillator that behaves more like a "true" momentum reading rather than a noisy derivative of price.
Midline directional filter: Unlike simple crossover systems that generate signals anywhere in the oscillator range, AMW restricts BUY signals to the lower half (below 50) and SELL signals to the upper half (above 50). This ensures entries occur when momentum is turning from a relatively extreme position, significantly reducing false signals during choppy, range-bound conditions.
Multi-layer visual feedback: The indicator provides four distinct visual layers — oscillator-signal cloud fill, horizontal zone lines, extreme zone background shading, and dynamic breach fills — giving traders an immediate, at-a-glance understanding of the current momentum state without needing to interpret raw numbers.
Clean sub-panel design: As a non-overlay oscillator, AMW keeps the price chart uncluttered while providing all momentum information in a dedicated panel, making it easy to combine with overlay-based indicators like moving averages or support/resistance tools.
How to Use
Add the indicator to your chart. It will appear in a separate panel below the price chart, displaying the oscillator (thick line), signal line (orange), and reference levels.
Watch for BUY triangles (green, at the bottom of the panel) — these appear when the oscillator crosses above the signal line while below the 50 midline, indicating a bullish momentum shift from a weak state.
Watch for SELL triangles (red, at the top of the panel) — these appear when the oscillator crosses below the signal line while above the 50 midline, indicating a bearish momentum shift from a strong state.
Use the cloud fill color between the oscillator and signal line to gauge the prevailing momentum direction — green for bullish, red for bearish.
Monitor the overbought (80) and oversold (20) zones. When the oscillator enters these shaded areas and the breach fill activates, the market is at a momentum extreme — be alert for potential reversals.
Set up alerts using the built-in "AMW Buy Signal" and "AMW Sell Signal" alert conditions to receive real-time notifications.
Customization
Momentum Length (default: 14): The RSI lookback period. Lower values (e.g., 8–10) make the oscillator more sensitive and responsive, suitable for scalping or lower timeframes. Higher values (e.g., 21–30) produce smoother, more stable readings for swing trading or higher timeframes.
Price Smoothing / HMA (default: 7): Controls the Hull Moving Average period applied to price before RSI calculation. Lower values preserve more price detail but allow more noise through; higher values produce a cleaner oscillator but introduce slight additional lag. Find the balance that suits your timeframe.
Signal Line Length (default: 9): The EMA period for the signal line. Shorter periods make the signal line more reactive, generating more frequent crossovers; longer periods produce fewer but potentially more reliable crossover signals.
Overbought Level (default: 80): The upper threshold for the extreme zone. Raise to 85 or 90 for fewer but more extreme overbought readings; lower to 70 or 75 for earlier warnings.
Oversold Level (default: 20): The lower threshold for the extreme zone. Lower to 10 or 15 for fewer but more extreme oversold readings; raise to 25 or 30 for earlier warnings.
All colors — bullish, bearish, and signal line — are fully customizable through the Colors & Aesthetics settings group.
Conclusion
The Apex Momentum Wave reimagines the classic RSI oscillator by introducing an HMA pre-smoothing stage that fundamentally improves signal quality. Combined with an EMA signal line for objective crossover timing and a midline directional filter that restricts entries to favorable momentum positions, AMW delivers a momentum oscillator that is both cleaner and more actionable than standard RSI implementations. Its multi-layer visual design — featuring cloud fills, zone shading, and dynamic breach highlights — provides traders with immediate, intuitive momentum context. Whether you trade stocks, forex, crypto, or futures, the Apex Momentum Wave adapts to your market and timeframe, offering a refined approach to momentum-based trading decisions. Индикатор

Индикатор

QQE Momentum Pulse Pro [identityKa]Overview
The QQE Momentum Pulse Pro is a highly responsive sub-chart oscillator designed to measure the velocity and magnitude of directional price movements. Traditional Quantitative Qualitative Estimation (QQE) indicators suffer from severe signal lag due to triple-layered EMA smoothing. This script addresses that core flaw by introducing an optional "Zero-Lag Engine," swapping the standard exponential smoothing for a dynamic Hull Moving Average (HMA), effectively eliminating lag while preserving the indicator's mathematical robustness.
Underlying Mathematics & Enhancements
The foundation of the engine is built upon the Relative Strength Index (RSI).
Volatility Trailing Bands: The script calculates the Absolute True Range of the smoothed RSI, which is then further smoothed using Wilder's methodologies. This creates dynamic fast and slow trailing bands that track the momentum.
The Pulse Histogram: Instead of plotting multiple confusing lines on the chart, this script calculates the exact mathematical difference (spread) between the smoothed RSI and the dynamic trailing band. This spread is plotted as a zero-line oscillating histogram.
Four-Color State Logic: The histogram's color intensity provides instant visual feedback regarding momentum acceleration. Bright Neon Green indicates rising positive momentum (acceleration), whereas Dark Green indicates positive but decaying momentum (deceleration). The same logic applies inversely for bearish trends with Bright/Dark Red.
HUD Dashboard & AI Logic
To prevent traders from getting trapped in exhausting trends, the integrated on-chart panel translates the histogram's state into a mechanical directive:
LONG: Triggered when the histogram is positive (above the zero line) and its value is strictly greater than the previous bar (actively growing).
SHORT: Triggered when the histogram is negative (below the zero line) and its value is strictly less than the previous bar (actively deepening).
Dangerous: This is the crucial risk-management state. It is triggered the exact moment the histogram shifts from bright to dark colors. It indicates a mathematical divergence where the macro trend may still exist, but the immediate momentum driving it is rapidly fading.
How to Use It
This tool is best paired with a main-chart trend indicator (like a SuperTrend or Moving Average crossover). Traders should look to execute LONG or SHORT entries when the Pulse Histogram crosses the zero line and the AI Suggestion aligns with their directional bias. If the AI Suggestion switches to "Dangerous", traders should consider scaling out of active positions, tightening stop-losses, or avoiding taking new trend-continuation entries, as a pullback or consolidation phase is statistically imminent. Индикатор

Advanced Volatility Squeeze Pro v2 [identityKa]Overview
The Advanced Volatility Squeeze Pro v2 is a comprehensive breakout and momentum oscillator. It is designed to identify periods of market consolidation (volatility compression) and mathematically anticipate the direction of the ensuing breakout. This script improves upon traditional squeeze models by replacing the often-lagging linear regression momentum with a highly responsive dual-EMA momentum engine.
Core Mathematical Concepts
This indicator relies on the mathematical relationship between two distinct volatility envelopes:
Bollinger Bands (Standard Deviation): Calculates the standard deviation of price around a Simple Moving Average (default length 20, multiplier 2.0). These bands expand and contract rapidly based on immediate price variance.
Keltner Channels (True Range): Calculates an envelope based on the Simple Moving Average of the True Range (default multiplier 1.5). These bands are less sensitive to sudden spikes and represent the baseline volatility.
The Squeeze Logic (Dots)
The script continuously compares the width of the Bollinger Bands to the Keltner Channels:
Squeeze ON (Red Dots): Triggered when the Bollinger Bands completely contract inside the Keltner Channels. This signifies a severe drop in volatility. The market is consolidating, building energy for a future move.
Squeeze OFF (Gray Dots): Triggered when the Bollinger Bands expand back outside the Keltner Channels. This mathematical event is known as the squeeze "firing," indicating a release of volatility and the start of a new directional trend.
The Momentum Engine (Histogram)
To determine the direction of the breakout, the script calculates the spread between a Fast EMA (default 8) and a Slow EMA (default 21).
The histogram plots this exact difference.
A rising positive histogram (Bright Green) indicates accelerating bullish momentum, while a falling negative histogram (Bright Red) indicates accelerating bearish momentum.
HUD Dashboard & AI Logic
The on-chart panel aggregates these calculations into an actionable state:
Dangerous: Displayed whenever the Squeeze is "ON". This warns traders that the market is range-bound and breakout direction is mathematically uncertain.
LONG: Triggered when the Squeeze fires (OFF), the momentum is positive (Fast EMA > Slow EMA), and the momentum value is actively rising compared to the previous bar.
SHORT: Triggered when the Squeeze fires (OFF), the momentum is negative, and actively falling.
How to Use It
Traders should avoid entering trend-continuation setups while the red dots (Squeeze ON) are present. The optimal setup occurs when a red dot transitions to a gray dot (Squeeze fires) in confluence with the AI Suggestion outputting a clear "LONG" or "SHORT" signal, allowing the trader to capture the explosive expansion in volatility. Индикатор

Advanced Momentum Engine [identityKa]Overview
The Advanced Momentum Engine is a technical oscillator designed to consolidate trend direction and momentum exhaustion into a single visual pane. By mathematically integrating Moving Average Convergence Divergence (MACD) with the Relative Strength Index (RSI), this script aims to reduce chart clutter and provide a strict, rule-based approach to confluence analysis.
Instead of monitoring MACD crossovers and RSI extreme levels in separate windows, this indicator unifies them. The MACD dictates the base histogram color representing the trend, while the RSI dictates specific color overrides when momentum reaches mathematical extremes.
Core Calculations & Logic
The engine operates on two primary technical formulas:
MACD Component: It utilizes the standard MACD calculation (Fast EMA 12, Slow EMA 26, Signal 9 by default). The histogram plots the spread between the MACD line and the Signal line.
RSI Component: A standard RSI (default length 14) is calculated simultaneously in the background to measure the speed and change of price movements.
Dynamic Visualization Features
The histogram colors are not static; they adapt dynamically based on the relationship between these two components:
Trend Phases: When the RSI is in a neutral state (between 30 and 70), the histogram reflects standard MACD momentum. Increasing positive spreads plot as Strong Bullish (Bright Green), decreasing positive spreads as Weak Bullish (Dark Green). The inverse applies to Bearish states (Bright Red / Dark Red).
The Danger Zone Override: If the background RSI calculation breaches the user-defined Overbought (≥70) or Oversold (≤30) thresholds, the script triggers an override. The histogram and background explicitly turn Orange. This mathematical condition indicates that while the MACD trend may still be active, the RSI momentum is statistically exhausted.
HUD Dashboard & AI Suggestion
To simplify real-time data interpretation, the script includes an on-chart panel (HUD) that evaluates the current bar's state and outputs a logical suggestion:
LONG: Triggered when MACD > Signal AND RSI is strictly neutral (< 70).
SHORT: Triggered when MACD < Signal AND RSI is strictly neutral (> 30).
Dangerous: Triggered whenever RSI ≥ 70 OR RSI ≤ 30.
How to Use It
Traders can use this script to filter their entries and manage risk. A standard approach is to look for trend-following entries only when the dashboard indicates a "LONG" or "SHORT" state. Conversely, when the histogram and dashboard turn to the Orange "Danger Zone," it serves as a mechanical rule to avoid new trend-continuation entries and consider tightening stop-losses, as mean reversion is statistically more probable. All moving average lengths, RSI thresholds, and color themes are fully adjustable in the settings. Индикатор

Aura Mean Reversion Envelopes [Pineify]Aura Mean Reversion Envelopes
The Aura Mean Reversion Envelopes is a volatility-adaptive envelope indicator designed to identify high-probability mean reversion trade setups. It combines a Hull Moving Average (HMA) baseline with ATR-based dynamic envelopes to detect when price has reached statistically extreme levels and is likely to revert back toward its fair value. Unlike static channel indicators, this tool continuously adapts its bands to current market volatility, making it effective across different instruments and timeframes.
Key Features
Hull Moving Average (HMA) as the central mean — provides a smooth, low-lag baseline that closely tracks the "fair value" of price.
ATR-based dynamic envelopes — four bands (inner and outer, upper and lower) that automatically expand and contract with market volatility.
Wick rejection reversal signals — BUY and SELL markers triggered only when price pierces the exhaustion zone but closes back inside with a confirming candlestick pattern.
Visual cloud zones — color-filled regions between bands clearly delineate overbought, oversold, and neutral mean-reversion corridors.
Extreme candle coloring — optional bar coloring highlights candles closing beyond the inner bands for at-a-glance identification of stretched price action.
Built-in alert conditions — configurable alerts for both bullish and bearish reversal signals so you never miss a setup.
How It Works
The indicator is built on the principle of mean reversion — the statistical tendency for price to return to its average after moving to an extreme. The core calculation pipeline is:
A Hull Moving Average (HMA) of the closing price over a user-defined period (default: 34) is computed. HMA was chosen over SMA or EMA because it dramatically reduces lag while maintaining smoothness, giving a more accurate representation of the current mean.
Market volatility is measured using the Average True Range (ATR) over a separate lookback period (default: 21). ATR captures the true range of each bar — including gaps — providing a robust, adaptive volatility metric.
Four envelope bands are constructed symmetrically around the HMA baseline by adding and subtracting ATR multiplied by two configurable multipliers: an inner multiplier (default: 1.618, the golden ratio) and an outer multiplier (default: 3.0). The inner bands define the boundary of normal price oscillation, while the outer bands mark exhaustion zones where price has deviated significantly.
Reversal signals are generated using a wick rejection pattern: a bullish signal fires when the bar's low pierces below the lower outer band, but the candle closes bullishly (close > open) and above the outer band. This pattern indicates that sellers pushed price to an extreme but were overwhelmed by buyers. The bearish signal uses the mirror logic on the upper side.
Trading Ideas and Insights
Mean reversion strategies work best in ranging and oscillating markets. Here are some practical ways to use this indicator:
Fade the extremes: When a BUY or SELL signal appears at the outer exhaustion band, consider entering a position targeting the central HMA mean line as your take-profit level. The mean line acts as a natural magnet for price.
Use the inner bands as a filter: If price is between the inner bands and the mean, the market is in "normal" territory — avoid counter-trend entries. Wait for price to reach the outer bands before looking for reversal setups.
Combine with trend context: On higher timeframes, determine the dominant trend direction. Then on your trading timeframe, only take signals that align with the higher-timeframe trend (e.g., only BUY signals in an uptrend) for higher win rates.
Watch for candle coloring clusters: Multiple consecutive colored candles beyond the inner band suggest sustained momentum — a reversal signal after such a cluster can be particularly powerful.
How Multiple Indicators Work Together
This indicator integrates two distinct technical concepts into a unified framework:
Hull Moving Average (trend/mean tracking) — The HMA serves as the anchor point, representing the current equilibrium price. Its low-lag property ensures the mean line stays close to actual price action rather than trailing behind, which is critical for accurate envelope placement.
Average True Range (volatility measurement) — ATR dynamically sizes the envelope bands. During high-volatility periods, the bands widen to avoid false signals; during low-volatility periods, they tighten to capture smaller but still meaningful deviations.
The synergy between these two components is what makes the indicator adaptive: the HMA tracks where price should be, while the ATR determines how far is too far. Together, they create a self-adjusting framework that does not require manual recalibration across different market conditions.
The reversal signal logic adds a third layer — candlestick pattern confirmation — by requiring a wick rejection at the outer band. This prevents signals from firing during strong breakouts where price legitimately moves beyond the envelope.
Unique Aspects
HMA over EMA/SMA: Most envelope indicators use simple or exponential moving averages, which introduce significant lag. The Hull Moving Average virtually eliminates this lag, resulting in more accurately centered envelopes.
Dual-layer envelope design: The inner and outer band structure creates distinct zones (normal, extended, exhaustion) rather than a single binary overbought/oversold threshold, giving traders more nuanced context.
Golden ratio default: The inner band multiplier defaults to 1.618 (the Fibonacci golden ratio), a mathematically significant threshold that aligns with natural price clustering behavior observed across many markets.
Wick rejection confirmation: Signals require both a pierce beyond the outer band AND a confirming close back inside with a bullish/bearish candle body, filtering out many false signals that plague simpler band-touch systems.
How to Use
Apply the indicator to your chart. It overlays directly on the price chart with the HMA mean line, four envelope bands, and color-filled zones.
Watch for BUY triangles below bars at the lower outer band and SELL triangles above bars at the upper outer band. These are the primary reversal signals.
Use the colored candles as an early warning — when candles start coloring, price is in the extended zone and approaching potential reversal territory.
Set alerts via the built-in alert conditions ("Bullish Mean Reversion" and "Bearish Mean Reversion") to receive notifications when signals fire.
Target the central HMA mean line for take-profit on reversal trades, or use the inner band on the opposite side for more aggressive targets.
Customization
Mean Tracking Period (default: 34): Controls the HMA lookback. Lower values make the mean more responsive to recent price; higher values produce a smoother, slower-moving baseline. Adjust based on your trading timeframe.
Volatility (ATR) Period (default: 21): Controls the ATR lookback for band sizing. Shorter periods make bands more reactive to recent volatility spikes; longer periods smooth out the band width.
Inner Band Multiplier (default: 1.618): Defines the boundary between normal and extended price zones. Increase for wider normal zones (fewer colored candles); decrease for tighter zones.
Outer Band Multiplier (default: 3.0): Defines the exhaustion zone threshold. Higher values produce fewer but more extreme signals; lower values generate more frequent signals.
Color Candles at Extremes: Toggle on/off the candle coloring feature for candles closing beyond the inner bands.
All colors (bullish, bearish, mean line) are fully customizable via the Aesthetics & Colors settings group.
Conclusion
The Aura Mean Reversion Envelopes combines the precision of the Hull Moving Average with ATR-adaptive volatility bands and candlestick-confirmed reversal signals to create a comprehensive mean reversion trading tool. Its dual-layer envelope design provides clear visual zones for identifying when price is normal, extended, or at exhaustion — helping traders time entries at statistically favorable levels where price is most likely to revert toward its mean. Whether you trade forex, crypto, stocks, or futures, this indicator adapts to your market's volatility and provides actionable signals with built-in confirmation logic. Индикатор
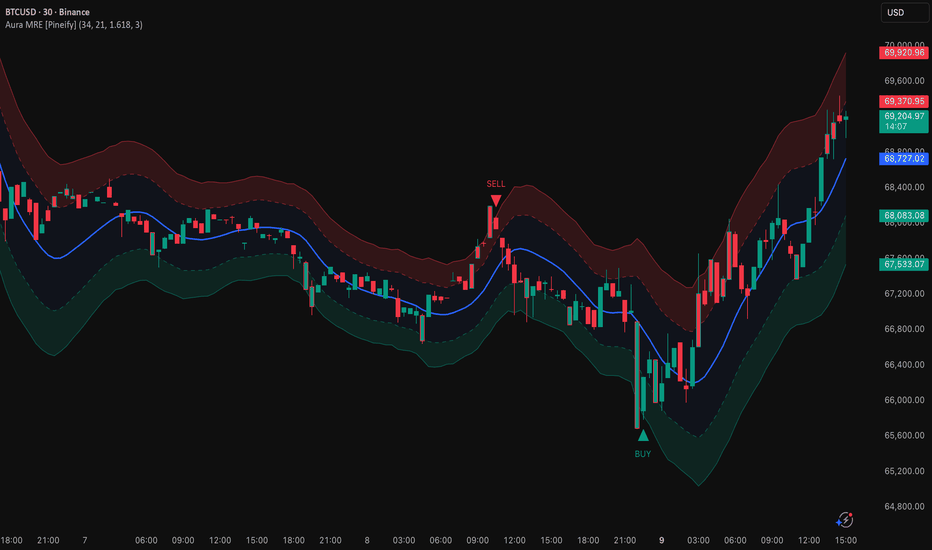
ueuito MACD Custom PROJust another MACD with something else...
Description
MACD Custom PRO is an advanced and highly configurable momentum indicator built around the classic Moving Average Convergence Divergence (MACD) concept. The indicator extends the traditional MACD framework by integrating additional filters, visual enhancements, and signal validation tools designed to help traders better interpret market momentum, volatility conditions, and trend alignment.
The indicator calculates the MACD line using the difference between two exponential moving averages of price: a fast EMA and a slow EMA. A signal line is then derived as an exponential moving average of the MACD line. The histogram represents the difference between the MACD line and the signal line and serves as a visual representation of momentum strength and direction.
The indicator introduces several configurable components that enhance the traditional MACD approach.
MACD Core Structure
The core of the indicator is the traditional MACD calculation:
Fast EMA – default length 12
Slow EMA – default length 26
Signal EMA – default length 9
The MACD line represents the difference between the fast and slow EMA. The signal line smooths the MACD values and helps identify crossovers. The histogram represents the distance between the two lines and visually highlights momentum expansion or contraction.
Histogram Visualization Modes
The histogram can be displayed using multiple color modes that provide different interpretations of momentum.
Classic MACD Mode
In the default configuration, the histogram uses four colors to represent momentum behavior relative to the zero line:
Positive and rising momentum
Positive but falling momentum
Negative but rising momentum
Negative and falling momentum
This visualization helps traders quickly identify momentum acceleration or deceleration.
Histogram Moving Average Mode
An optional moving average of the histogram can be enabled. This moving average can be calculated using one of four selectable methods:
EMA
SMA
WMA
RMA
When enabled, the histogram moving average acts as a smoothing layer that can help identify changes in momentum structure earlier than traditional MACD signals.
The histogram moving average can also dynamically change color depending on whether the histogram is above or below the average, helping traders visualize shifts in momentum direction.
Momentum Color Mode
A momentum-based color mode is available that classifies histogram bars relative to the histogram moving average and their direction of movement.
This produces four states of momentum:
Histogram above its average and rising (strong bullish momentum)
Histogram above its average but falling (momentum weakening)
Histogram below its average but rising (potential reversal or recovery)
Histogram below its average and falling (strong bearish momentum)
This mode can help traders identify early shifts in momentum before traditional MACD crossovers occur.
ATR Volatility Filter
The indicator includes an optional volatility filter based on the Average True Range (ATR).
ATR is used to determine whether market volatility is sufficient to validate trading signals. When the filter is enabled, signals will only be considered valid when the ATR exceeds a moving average of the ATR multiplied by a configurable threshold.
This helps reduce false signals during low-volatility market conditions where MACD crossovers often become unreliable.
Zero Line Filter
An optional zero-line filter can be applied to MACD signals.
When enabled:
Bullish signals are only valid when the MACD line is above zero.
Bearish signals are only valid when the MACD line is below zero.
This filter ensures that trades are aligned with the broader momentum direction.
Trend Filter Using EMA
The indicator can optionally incorporate a trend filter based on a long-term exponential moving average of price.
When enabled:
Bullish signals are allowed only when price is above the trend EMA.
Bearish signals are allowed only when price is below the trend EMA.
This feature helps align momentum signals with the broader market trend.
MACD Line Direction Coloring
The MACD line and signal line dynamically change color depending on whether they are rising or falling. This visual feedback provides an additional layer of momentum interpretation and allows traders to see shifts in direction more easily.
MACD Cross Markers
Optional visual markers can be displayed whenever the MACD line crosses the signal line.
The shape and color of these markers can be customized, allowing traders to highlight key crossover events directly on the indicator panel.
Histogram Moving Average Cross Signals
The indicator also detects crossovers between the histogram and its moving average. These events often occur earlier than MACD line crossovers and can provide early warnings of momentum shifts.
Alert conditions are included for these events, allowing users to create automated notifications when they occur.
Trend Background Visualization
A background coloring feature can be enabled to visually represent strong trend alignment.
The background turns bullish when:
MACD is above the signal line and
The histogram is above its moving average.
The background turns bearish when:
MACD is below the signal line and
The histogram is below its moving average.
This feature helps traders visually identify sustained momentum environments.
Possible Use Cases
This indicator can be applied in multiple trading approaches.
Momentum trading
Traders can use the histogram momentum coloring to detect strengthening or weakening momentum and enter trades during early momentum expansion.
Trend-following strategies
By enabling the trend filter and zero-line filter, the indicator can be used to identify MACD signals that align with broader market direction.
Volatility-aware trading
The ATR filter can help avoid entering trades during periods of insufficient volatility, improving signal quality.
Early momentum detection
Histogram moving average crossovers can serve as an early signal that momentum is shifting before traditional MACD crossovers occur.
Multi-filter signal confirmation
By combining ATR filtering, trend filtering, and zero-line filtering, traders can significantly reduce noise and focus on higher probability setups.
Timeframe flexibility
The indicator can be applied across multiple timeframes and markets including stocks, cryptocurrencies, forex, and indices.
Risk Disclaimer
Trading financial markets involves substantial risk and may not be suitable for all investors. Indicators and technical analysis tools are designed to assist in decision-making but they do not guarantee profitable results. Market conditions can change rapidly and no indicator can predict price movements with certainty. Traders should always apply proper risk management, conduct their own analysis, and understand that past performance does not guarantee future outcomes. Индикатор

Индикатор
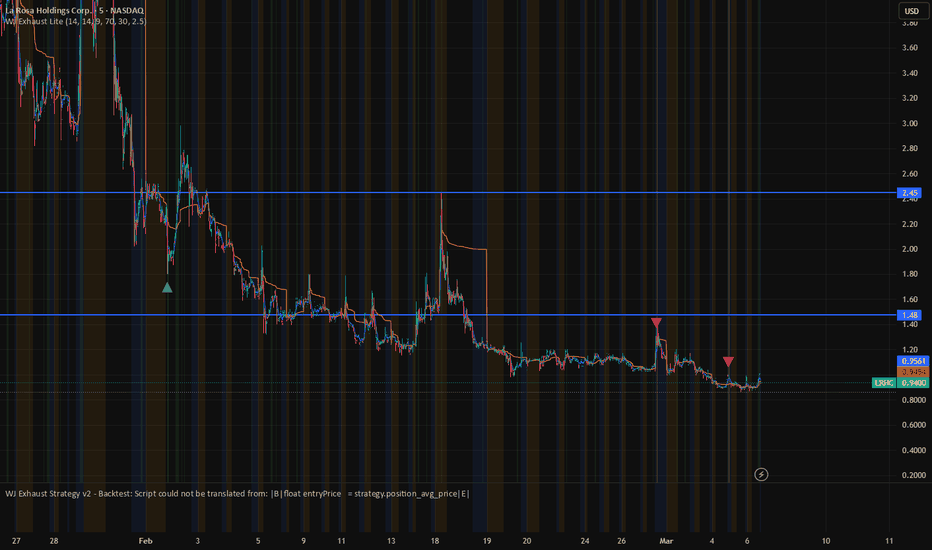
AVANTI MASTER PRO FINALAVANTI MASTER PRO FINAL – Smart Intraday Trend & Breakout System
AVANTI MASTER PRO FINAL is an advanced intraday trading indicator designed to identify high-probability buy and sell opportunities using a combination of trend analysis, momentum strength, breakout scoring, and smart money behavior.
This indicator integrates multiple technical factors such as EMA trend structure, RSI momentum, breakout strength analysis, buildup detection, ADX trend strength filter, and multi-timeframe confirmation to help traders avoid sideways markets and focus on strong trending moves.
The system automatically generates entry signals and calculates risk-reward targets for different instruments.
Key Features
Trend Detection
Uses EMA 9, EMA 30, and EMA 200 to determine the overall market trend.
Multi-Timeframe Trend Filter
Signals are confirmed only when 5-minute and 15-minute trends align, improving trade accuracy.
Breakout Strength Score
A scoring system evaluates multiple bullish and bearish conditions to determine breakout probability.
RSI Momentum Confirmation
RSI is used to validate market momentum before generating signals.
ADX Trend Strength Filter
Signals are generated only when ADX > 23, helping to avoid sideways markets.
Buildup Analysis
Detects Long Buildup, Short Buildup, Short Covering, and Long Unwinding based on price and volume behavior.
Auto Target System
Automatically calculates Entry, TP1, TP2, TP3, and Stop Loss depending on the instrument.
Supported Instruments
Targets are optimized for:
• NIFTY
• Stock Options
• Crude Oil
• Natural Gas
Dashboard Information
The built-in dashboard displays key market insights such as:
• Trend status
• RSI momentum
• Breakout / Breakdown strength
• ADX trend strength
• Market buildup
• Trade zone indication
Best Use
This indicator is designed for intraday trading and trend continuation setups where strong momentum and trend confirmation are present.
Works best in trending markets.
Developed by AVANTI STOCKS – Satish D. Nakhate Индикатор

HMA-Kahlman Trend & TrendlinesHMA-Kahlman Trend & Trendlines
Pine Script™ v6 | Overlay Indicator
by NPR21
Publication Description
A professional-grade trend identification and dynamic trendline indicator that combines two powerful analytical modules into a single overlay. The HMA-Kahlman Trend Module applies an optional Kalman filter to the Hull Moving Average for ultra-smooth, low-lag trend detection. The Trendlines Module auto-detects pivot highs and lows, draws connecting support/resistance trendlines, and projects dashed extension lines into the future. Together, they deliver real-time trend direction, precise BUY/SELL crossover signals, and automatically drawn structural trendlines—all from one indicator.
Built for any liquid market—futures, forex, stocks, crypto, and commodities. Works on all timeframes from 1-minute scalping charts to daily swing setups.
What Makes This Indicator Unique
Most trend indicators force you to choose between responsiveness and smoothness. This indicator eliminates that tradeoff by layering a Kalman filter on top of the Hull Moving Average—a combination rarely seen in Pine Script. The Kalman filter is an adaptive smoothing algorithm originally developed for aerospace navigation that dynamically adjusts its output based on incoming price data, removing noise without introducing the lag typical of traditional moving averages.
Key Differentiators
•Dual-engine trend detection: Standard HMA (Line A) and a triple-weighted HMA3 variant (Line B) run simultaneously. Their crossovers generate high-confidence directional signals because each line processes price through a fundamentally different weighting scheme.
•Kalman-filtered smoothing: The optional Kalman filter with adjustable gain lets you dial in exactly how much noise reduction you want—from aggressive scalping responsiveness (high gain) to smooth swing-trade clarity (low gain).
•Auto-drawn structural trendlines: The Trendlines Module detects pivot highs and lows, connects the two most recent pivots with dashed resistance/support lines, and projects extension lines forward—giving you dynamic S/R levels without any manual drawing.
•Integrated signal + structure: Unlike stacking separate indicators, the HMA length parameter drives both the trend engine and the pivot detection, creating a unified analytical framework where signals and structure are inherently synchronized.
Significant Changes from the Original ThinkScript
This indicator was originally developed as a ThinkScript study for the ThinkorSwim platform (HMA-Kahlman concept by capissimo, ported by @bvaikunth; Trendlines Module by Joris Duyck). The Pine Script v6 conversion introduces substantial enhancements beyond a straight port:
Visual & UX Upgrades
•Professional BUY/SELL signal labels: Replaced the original single-character “B”/“S” bubbles with stacked directional labels (▲/BUY, SELL/▼) anchored at bar highs and lows for instant visual recognition.
•Fully customizable signal colors: Four new color inputs (Buy background, Buy text, Sell background, Sell text) give complete control over signal appearance. The original had hardcoded white labels.
•Live price balloon captions: HMA-Kahlman A and B lines each display a real-time balloon label in the expansion area showing the current value formatted with dollar sign and comma-separated thousands (e.g., $24,674.25). The original had no price readout.
•Extension bridge lines: A one-bar extension line projects each HMA line into the future so the plotted line seamlessly connects to its balloon label pointer—a polished visual touch absent from the original.
•Z-order signal priority: BUY/SELL labels render on top of all other plot elements (cloud, trendlines, candles) using explicit_plot_zorder, ensuring signals are always visible regardless of chart density.
•Adjustable label sizing: Five size presets (Tiny through Huge) accommodate different screen sizes and visual preferences. The original offered no size control.
Technical & Structural Improvements
•Pine Script v6 native architecture: Complete rewrite using Pine’s built-in ta.pivothigh()/ta.pivotlow() functions instead of ThinkScript’s manual fold-loop pivot detection—more efficient and maintainable.
•Global-scope ta.highest/ta.lowest: Extension clipping boundary calculations moved to global scope for Pine Script consistency compliance (eliminates the “extract from this scope” warning).
•Full color customization: Resistance, support, extension, and signal colors are all user-configurable inputs. The original used hardcoded colors throughout.
•Configurable trendline extensions: Extension length (bars), upper/lower clipping boundaries (%), and visibility toggles are all exposed as inputs. The original had fixed 20-bar extensions with 5% limits and no toggles.
•Built-in alert conditions: Two alertconditions (Buy Signal, Sell Signal) enable push notifications, email, or webhook triggers on crossovers—functionality the ThinkScript version did not include.
•Organized input groups with tooltips: All inputs are grouped into logical sections (HMA-Kahlman Trend, Trendlines) with descriptive tooltips explaining each parameter. The original had flat, unlabeled inputs.
•Optimized opacity defaults: HMA lines default to 90% opacity and the trend cloud to 30% opacity, providing clear visual hierarchy without obscuring price action.
How to Use This Indicator
Adding to Your Chart
1.Open any chart on TradingView (works on all markets and timeframes).
2.Click Indicators and search for “HMA-Kahlman Trend & Trendlines.”
3.Add to chart. The indicator overlays directly on your candlestick/bar chart.
4.Open Settings (gear icon) to customize colors, lengths, and visibility toggles.
Reading the Trend
The indicator plots two HMA-Kahlman lines (A and B) with a shaded cloud between them. When Line B is above Line A, the trend is bullish and the cloud/lines turn aqua/green. When Line A is above Line B, the trend is bearish and everything shifts to red. The balloon labels in the expansion area show the real-time price of each line for quick reference.
Trading the Signals
•▲ BUY signal: Appears below the bar when Line B crosses above Line A (bullish crossover). This indicates momentum shifting to the upside.
•SELL ▼ signal: Appears above the bar when Line A crosses above Line B (bearish crossover). This indicates momentum shifting to the downside.
•Best practice: Use BUY/SELL signals in confluence with the auto-drawn trendlines. A BUY signal near a support trendline or extension carries higher conviction than a signal in open space. Similarly, a SELL signal near resistance reinforces the short bias.
Using the Trendlines
The indicator automatically detects the two most recent pivot highs and pivot lows, connects them with dashed trendlines (resistance in red, support in green by default), and projects dotted extension lines forward. These extensions act as dynamic support/resistance targets. Watch for price reactions at extension levels—bounces confirm the trendline, breaks suggest a structural shift.
Recommended Settings by Style
Trading Style HMA Length Kalman Gain Notes
Scalping (1–5 min) 8–14 0.7–1.0 Higher gain for faster response to micro moves
Day Trading (5–30 min) 14–22 0.5–0.7 Default settings optimized for this range
Swing Trading (1H–Daily) 22–50 0.3–0.5 Lower gain smooths out intraday noise
Setting Up Alerts
Right-click the indicator on your chart and select Add Alert. Two conditions are available: HMA-Kahlman Buy Signal and HMA-Kahlman Sell Signal. Configure for push notifications, email, webhook, or any combination to stay informed of crossover events in real time.
Disclaimer
This indicator is a technical analysis tool for educational and informational purposes. It does not constitute financial advice. No indicator guarantees future results. Always use proper risk management and combine signals with your own analysis and trading plan before entering any trade.
Credits
Original HMA-Kahlman Trend concept by capissimo, ThinkScript port by @bvaikunth. Trendlines Module by Joris Duyck. Pine Script v6 conversion, enhancements, and professional visual upgrades by NPR21. Индикатор
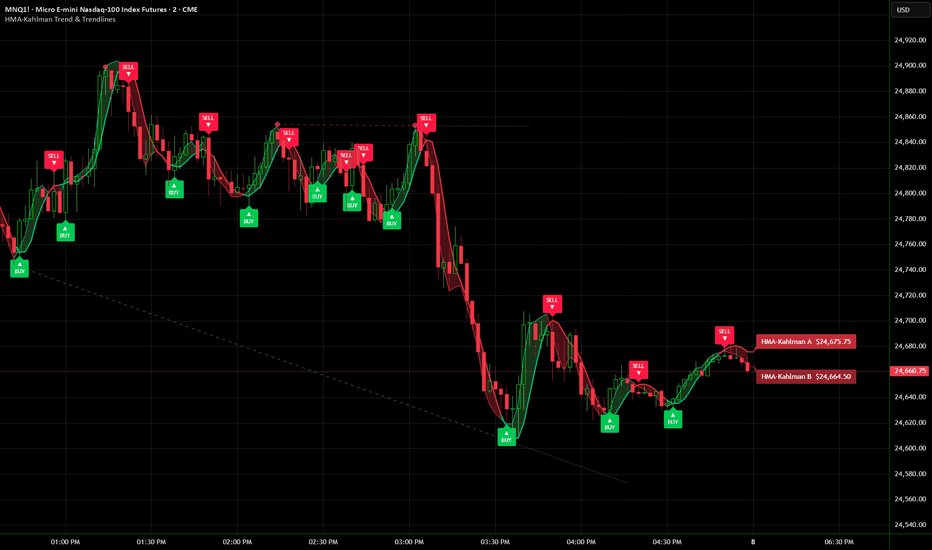
Индикатор

Aura Trend & Candlestick Matrix [Pineify]Aura Trend & Candlestick Matrix — EMA Trend Cloud with Trend-Aligned Candlestick Pattern Detection and Dynamic Support & Resistance
The Aura Trend & Candlestick Matrix is a multi-layered technical analysis indicator that fuses an EMA-based trend cloud, classic candlestick pattern recognition, and pivot-derived support and resistance levels into a single, cohesive overlay. Its core philosophy is confluence : rather than firing candlestick signals in isolation, every pattern must first pass through a directional trend filter before it reaches the chart. A Hammer is only displayed when the trend cloud confirms bullish momentum; a Shooting Star only appears when the cloud is bearish. This trend-alignment mechanism dramatically reduces noise and false signals, giving traders a cleaner, higher-probability view of potential reversal and continuation setups — all without leaving the price chart.
Key Features
Dual-EMA "Aura Cloud" that visually maps trend direction and strength through a color-coded filled region between a fast and slow exponential moving average
Three families of candlestick pattern detection — Hammer / Shooting Star, Bullish / Bearish Engulfing, and Morning Star / Evening Star — each identified using precise shadow-to-body ratio and multi-bar structural rules
Trend-alignment filter that only surfaces bullish patterns during confirmed uptrends and bearish patterns during confirmed downtrends, eliminating counter-trend noise
Dynamic pivot-based support and resistance levels that automatically update as new structural highs and lows are confirmed
Optional candle coloring that tints every bar green or red based on the prevailing trend for instant visual context
Built-in alert conditions for both bullish and bearish setups, enabling automated notification workflows without additional configuration
How It Works
The indicator is built on three independent analytical engines that feed into a unified signal pipeline.
Engine 1: The Aura Trend Cloud
Two exponential moving averages — a fast EMA (default 20 periods) and a slow EMA (default 50 periods) — are plotted on the chart. When the fast EMA is above the slow EMA, the trend is classified as bullish; when below, bearish. The region between the two EMAs is filled with a semi-transparent color (green for bullish, red for bearish), creating the "Aura Cloud." This cloud serves two purposes: it provides an immediate visual representation of trend direction and strength (a widening cloud suggests strengthening momentum), and it acts as the gatekeeper for all candlestick pattern signals.
Engine 2: Candlestick Pattern Detection
The pattern detection engine analyzes candle anatomy using shadow-to-body ratios and multi-bar structural relationships:
Hammer & Shooting Star — Single-candle patterns identified by comparing the lower shadow proportion, upper shadow proportion, and body proportion relative to the full candle range. A Hammer requires a lower shadow at least twice the body size, a body less than 50% of the range, an upper shadow under 15%, and a bullish close. The Shooting Star applies the mirror criteria with a bearish close. Doji candles (body < 10% of range) are excluded to avoid ambiguity.
Bullish & Bearish Engulfing — Two-candle patterns where the current candle's real body completely wraps the previous candle's body. An additional 120% size threshold ensures the engulfing candle demonstrates meaningful conviction beyond a marginal overlap.
Morning Star & Evening Star — Three-candle reversal patterns. A Morning Star requires a bearish candle two bars ago, a small-bodied middle candle (less than 50% of the prior body), and a bullish current candle that closes above the midpoint of the first candle's body. The Evening Star applies the inverse logic.
Engine 3: Dynamic Support & Resistance
The indicator uses Pine Script's pivot detection functions with a configurable lookback window (default 10 bars on each side). When a bar's high is confirmed as the highest within the lookback window, it becomes the current resistance level. When a bar's low is the lowest, it becomes the current support level. These levels persist on the chart as circle markers until a new pivot replaces them, providing a continuously updated structural reference frame.
Trading Ideas and Insights
Cloud Bounce + Pattern Confirmation — When price pulls back to the Aura Cloud boundary during an uptrend and a Hammer or Bullish Engulfing pattern fires at the cloud's edge, this represents a high-confluence long entry. The cloud acts as dynamic support, and the candlestick pattern provides the timing trigger.
Trend Reversal Detection — Watch for Morning Star or Evening Star patterns forming near pivot-based support or resistance levels just as the trend cloud begins to narrow. A narrowing cloud suggests weakening momentum, and a three-candle reversal pattern at a key structural level can signal an early trend change.
S/R Level Validation — Use the dynamic support and resistance levels to validate candlestick signals. A Bullish Engulfing pattern that forms precisely at the current support level carries more weight than one occurring at a random price point.
Trend Strength Assessment — The width of the Aura Cloud reflects the separation between the fast and slow EMAs. A wide, expanding cloud indicates strong trending conditions where trend-aligned patterns are most reliable. A narrow, contracting cloud suggests consolidation where signals should be treated with more caution.
Multi-Timeframe Confluence — Apply the indicator on a higher timeframe to establish the dominant trend direction, then switch to a lower timeframe to find trend-aligned candlestick entries. The cloud's direction on the higher timeframe provides the bias; the pattern signals on the lower timeframe provide the entry timing.
How Multiple Indicators Work Together
The Aura Trend & Candlestick Matrix integrates three distinct analytical techniques into a single decision-support system through a deliberate hierarchical architecture:
The EMA trend cloud establishes directional context, the candlestick pattern engine identifies potential reversal and continuation setups, and the pivot-based support and resistance levels provide structural price references — together forming a confluence-driven framework where signals must pass through multiple filters before reaching the chart.
The trend cloud sits at the top of the hierarchy as the primary directional filter. It answers the fundamental question: "Which side of the market should I be on right now?" By requiring all candlestick patterns to align with the cloud's direction, the indicator enforces a disciplined approach that avoids the common trap of trading counter-trend reversal patterns in strong trends.
The candlestick pattern engine operates as the timing mechanism within the trend context. Each pattern family captures a different market dynamic — Hammers and Shooting Stars detect single-bar rejection of price levels, Engulfing patterns identify momentum shifts through body-size dominance, and Morning/Evening Stars capture multi-bar sentiment transitions. By offering all three families simultaneously, the indicator provides multiple entry opportunities across different market conditions while maintaining the trend-alignment requirement.
The dynamic support and resistance engine adds a structural dimension that complements both the trend cloud and the pattern signals. While the cloud tells you the trend direction and the patterns tell you when to act, the S/R levels tell you where price is likely to react. Patterns forming at or near these pivot-derived levels carry inherently higher significance because they occur at prices where the market has previously demonstrated supply or demand.
Unique Aspects
Trend-gated pattern signals — Unlike standalone candlestick scanners that display every detected pattern regardless of context, this indicator enforces directional alignment. Bullish patterns are suppressed during downtrends and bearish patterns are suppressed during uptrends, producing a significantly cleaner signal set with higher expected reliability.
Ratio-based pattern detection with doji exclusion — Pattern identification uses proportional shadow-to-body ratios rather than fixed pip or point thresholds, making the detection logic adaptive across instruments and timeframes. The explicit doji exclusion prevents ambiguous candles from triggering false Hammer or Shooting Star signals.
120% engulfing threshold — The Engulfing pattern requires the current body to exceed the previous body by at least 20%, filtering out marginal engulfing candles that lack conviction and improving signal quality.
Three-engine confluence in a single overlay — By combining trend analysis, pattern recognition, and support/resistance detection in one indicator, traders avoid the visual clutter and potential conflicts of layering multiple separate tools on the same chart.
Distinct visual vocabulary — Each pattern family uses a unique shape (triangles for Engulfing, labeled markers for Hammers/Stars), allowing traders to instantly identify the pattern type without reading text labels.
How to Use
Add the Aura Trend & Candlestick Matrix to your chart. It overlays directly on the price chart, displaying the Aura Cloud, pattern signals, and S/R levels simultaneously.
Identify the current trend by observing the Aura Cloud color — a green cloud indicates a bullish trend (fast EMA above slow EMA), and a red cloud indicates a bearish trend. The cloud's width reflects trend strength.
Watch for candlestick pattern signals that appear on the chart. Green triangles (▲) below bars indicate Bullish Engulfing patterns; red triangles (▼) above bars indicate Bearish Engulfing. Labels marked "H", "S", "MS", and "ES" denote Hammer, Shooting Star, Morning Star, and Evening Star patterns respectively.
Cross-reference pattern signals with the dynamic S/R levels (green and red circle markers). Patterns occurring near support (for bullish) or resistance (for bearish) carry additional structural significance.
Use the candle coloring feature (enabled by default) for quick visual scanning — green candles confirm you are in a bullish trend zone, red candles confirm a bearish trend zone.
Set up alerts using the built-in "Bullish Setup" and "Bearish Setup" alert conditions to receive real-time notifications when a trend-aligned candlestick pattern is detected.
Combine with volume analysis or momentum oscillators for additional confirmation layers when entering trades based on the indicator's signals.
Customization
Fast EMA Length (default: 20) — Controls the responsiveness of the fast trend line. Lower values (10-15) make the cloud more reactive to recent price changes, suitable for shorter-term trading. Higher values (25-50) produce a smoother cloud for swing or position trading.
Slow EMA Length (default: 50) — Sets the anchor for the trend cloud. Common alternatives include 100 or 200 for longer-term trend identification. The gap between fast and slow lengths determines how quickly the cloud changes direction.
Color Candles Based on Trend (default: on) — Toggle candle coloring on or off. Disable if you prefer to use your chart's native candle colors or another coloring scheme.
Show Hammers / Shooting Stars (default: on) — Enable or disable single-candle reversal pattern detection. Disable if you prefer to focus only on multi-candle patterns.
Show Engulfing Patterns (default: on) — Enable or disable two-candle engulfing pattern detection.
Show Morning / Evening Stars (default: on) — Enable or disable three-candle star pattern detection.
Pivot Detection Length (default: 10) — Controls the lookback window for support and resistance detection. Lower values (3-7) detect more frequent, minor pivot levels; higher values (15-30) identify only major structural turning points.
Conclusion
The Aura Trend & Candlestick Matrix delivers a disciplined, confluence-based approach to technical analysis by requiring candlestick patterns to align with the prevailing EMA trend direction before they are displayed. By integrating a visual trend cloud, three families of rigorously defined candlestick patterns, and dynamic pivot-based support and resistance levels into a single overlay, this indicator provides traders with a comprehensive yet uncluttered analytical framework. Whether you are a day trader looking for precise trend-aligned reversal entries, a swing trader seeking high-probability pattern setups at key structural levels, or a position trader monitoring broad trend direction with candlestick confirmation, the Aura Trend & Candlestick Matrix offers a clean, systematic, and visually intuitive toolset for identifying where trend momentum and candlestick structure converge — the moments where trading opportunities are most compelling.
Индикатор

Momentum Lifecycle Detector [BullByte]Momentum Lifecycle Detector
An early trend detection oscillator that tracks momentum through five lifecycle phases - from birth to death - using DI spread acceleration analysis . Designed to identify momentum ignition before traditional ADX signals, and warn of trend exhaustion before it becomes obvious.
WHAT THIS INDICATOR DOES
The Momentum Lifecycle Detector (MLD) is a momentum oscillator with integrated trend phase classification. It answers the question every trend trader needs answered: "Where in its life is this momentum right now?"
Most trend strength indicators tell you a trend exists after the move is already underway. ADX crossing above 25 is a lagging confirmation. MLD solves this by detecting the birth of momentum at the earliest mathematically identifiable point, then tracking that momentum through five distinct lifecycle phases until it dies.
The indicator displays:
An ATR-normalized momentum oscillator (the main line you follow)
A signal line for crossover analysis
A histogram showing momentum-signal divergence
A colored lifecycle band showing the current phase
Consolidation zone boxes marking coiled energy before breakouts
A reversal atmosphere glow when momentum curvature suggests reversal
A dashboard summarizing momentum conditions at a glance
Adaptive dead zone and choppy market warnings
THE PROBLEM THIS SOLVES - WHY TRADERS NEED EARLY TREND DETECTION
Traditional ADX tells you a trend is strong when it crosses above 25. By that point, the optimal entry window has often closed. Conversely, ADX gives no clear warning when a trend is dying - it just slowly rolls over after the move has already reversed.
The core innovation in MLD is measuring the acceleration of the gap between +DI and -DI. Here is the mathematical logic:
Spread = |+DI minus -DI| - How far apart are bullish and bearish pressure?
Velocity = Spread minus Spread - Is that gap widening or narrowing?
Acceleration = Velocity minus Velocity - Is the widening itself speeding up?
When acceleration is positive and velocity is positive while ADX is still low, a new trend is actively forming. This is the mathematical fingerprint of momentum at birth - detectable bars before ADX would give any signal.
WHY THESE SPECIFIC COMPONENTS - JUSTIFICATION FOR THE INTEGRATION
This indicator combines several analytical methods into a unified lifecycle detection framework. Each component serves a specific, non-redundant purpose. Here is why each exists:
Zero-Lag EMA Momentum Oscillator
Purpose : The primary visual output traders watch and trade.
Method : Difference between fast ZLEMA (default 9) and slow ZLEMA (default 21), divided by ATR, multiplied by 100.
Why ZLEMA : Standard EMA lags behind price. ZLEMA compensates by adding the difference between the current price and its lagged value before smoothing. This produces earlier momentum readings without adding noise.
Why ATR normalization: Raw price differences are not comparable across instruments. A 5-point move means something different on a $10 stock versus Bitcoin. Dividing by ATR makes oscillator readings universal - a reading of +50 represents the same relative momentum strength on any chart, any timeframe.
Gaussian-Weighted Directional Indicators
Purpose : Feed responsive directional data into the lifecycle detection engine.
Method : Instead of standard Wilder smoothing for +DI and -DI, a Gaussian (bell-curve) decay function applies exponentially more weight to recent bars. The formula is exp(-(n/len)^2).
Why Gaussian weighting : Standard DI treats all bars in the lookback equally. A directional move from 14 bars ago counts the same as one happening now. Gaussian decay makes DI inherently more responsive to fresh moves without shortening the period (which would increase noise).
ZLEMA-Smoothed ADX
Purpose : Trend strength measurement for phase classification.
Method : DX calculated from Gaussian-weighted DI values, smoothed with ZLEMA instead of traditional Wilder smoothing.
Why ZLEMA-smoothed: Standard Wilder-smoothed ADX is deliberately sluggish by design. For lifecycle detection, we need ADX that responds faster to "waking up" and "rolling over" behaviors that define phase transitions.
DI Spread Acceleration Engine
Purpose : The core innovation - detects momentum birth before ADX confirms.
Method : Calculates the absolute spread between +DI and -DI, derives its velocity (first derivative) and acceleration (second derivative), smooths both with 3-period EMA.
Why this matters: This is what differentiates MLD from existing ADX-based tools. Acceleration of the DI spread is a leading indicator. By the time ADX crosses a threshold, spread acceleration has already been positive for multiple bars. This enables IGNITION detection before traditional signals fire.
Kaufman Efficiency Ratio
Purpose : Regime filter that warns when conditions are choppy.
Method : ER = net price movement divided by total price movement. Values near 1.0 mean efficient directional movement. Values near 0.0 mean price went back and forth without progress.
Why included: Momentum oscillators generate false signals in ranging markets. When ER is low, ADX is weak, and momentum sits inside the dead zone, the background turns gray - warning traders that conditions do not support directional strategies.
Momentum Curvature Analysis
Purpose : Early warning of potential reversals via oscillator curvature.
Method : Second derivative of momentum (how the slope is changing). When momentum is negative but curving upward (positive curvature with positive slope), bullish pressure is building from underneath before the trend visibly reverses. Strength is normalized against 30-bar standard deviation of curvature.
Important : This is purely mathematical curvature of the plotted oscillator. It does not use order flow, volume profile, bid/ask data, or any external source. The term "atmosphere" is a visual metaphor for the glow effect.
These components form an integrated pipeline - they are not independent indicators placed on the same pane. The oscillator provides visual momentum reading, Gaussian DI and ZLEMA ADX feed the lifecycle engine, spread acceleration detects phase transitions, ER provides regime context, and curvature adds reversal awareness. Each output feeds downstream components.
THE FIVE LIFECYCLE PHASES - DETECTION LOGIC EXPLAINED
The lifecycle band at the bottom displays one of five phases. Each has specific mathematical conditions that must all be true simultaneously. A state machine with configurable inertia prevents rapid flickering.
IGNITION - Cyan Band
Conditions : DI crossover within last N bars (default 4), spread acceleration above threshold (default 0.2), spread velocity above threshold (default 0.3), ADX rising for two consecutive bars.
Meaning : Momentum is being born. DI lines just crossed, the gap is accelerating open, ADX is waking. This is the earliest actionable signal. ADX may still be below 20.
State machine : IGNITION transitions instantly (1-bar inertia) because early detection speed matters.
THRUST - Green or Red Band (direction-coded)
Conditions : Past ignition window but within 3x that window, spread velocity above threshold (default 0.5), ADX surged more than threshold (default 1.5) over 3 bars.
Meaning : Young trend gaining real power. Spread velocity is high, ADX is confirming with a surge. The trend is no longer hypothesis - it is building strength.
State machine : THRUST transitions instantly.
PRIME - Deeper Green or Red Band (direction-coded)
Conditions : ADX above strong threshold (default 20), ADX either rising or above its signal line, DI spread above minimum (default 10).
Meaning : Mature, established trend. Maximum directional strength. Most productive phase - but also where exhaustion can begin. Use trailing stops.
State machine : Requires configured inertia (default 2 bars) before transition.
FADING - Orange Band
Conditions : ADX above strong threshold BUT falling AND below its signal line, OR ADX strong but spread velocity sharply negative (below -0.5).
Meaning : Trend is dying. ADX rolling over, DI gap closing. Time to tighten stops, take partials, prepare for next cycle.
State machine: Requires configured inertia before transition.
DEAD - Dark Gray Band
Conditions : None of the above active.
Meaning : No meaningful directional momentum. Market ranging, consolidating, or in transition. Directional strategies unlikely to perform well.
HOW TO READ THE OSCILLATOR PLOT
Momentum Line (thick, color-coded)
Bright green : Momentum positive and rising (bullish, strengthening)
Faded green : Momentum positive but falling (bullish, weakening)
Bright red: Momentum negative and falling (bearish, strengthening)
Faded red : Momentum negative but rising (bearish, weakening)
Gray : Momentum inside dead zone (noise, not signal)
Signal Line (thin orange)
EMA of momentum. Crossovers between momentum and signal highlight directional shifts, similar to MACD signal line usage.
Momentum-Signal Fill (shaded area between the two lines)
Teal shading: Momentum above signal (bullish bias)
Maroon shading: Momentum below signal (bearish bias)
This fill provides instant visual recognition of which line is dominant.
Histogram (vertical columns at zero line)
Shows the gap between momentum and signal.
Bright columns: Gap expanding (momentum pulling away, trend strengthening)
Faded columns: Gap contracting (momentum converging, trend weakening)
Green: Momentum above signal. Red: Momentum below signal.
Dead Zone (gray horizontal band around zero)
Dynamically calculated as a multiple (default 0.5x) of momentum's 50-bar standard deviation.
When momentum is inside this zone, directional signals are unreliable - the reading is within normal noise range.
Zero Line (dotted horizontal)
Momentum above zero: Net bullish pressure
Momentum below zero: Net bearish pressure
Zero line crosses represent directional bias shifts.
CONSOLIDATION ZONES - COILED ENERGY BEFORE BREAKOUTS
Yellow boxes appear on the oscillator when momentum energy is coiling - a potential precursor to a strong directional move.
Detection Logic
Two conditions must be simultaneously true:
Histogram (momentum-signal gap) is unusually tight relative to its recent 50-bar standard deviation.
Momentum slope is unusually flat relative to its recent 50-bar standard deviation.
Both thresholds are adaptive - they automatically adjust to each instrument's typical behavior. This means the indicator detects relative consolidation, not absolute levels, making it equally effective on volatile crypto and stable bonds.
Zone Lifecycle
New zone starts as dotted-border, light yellow box.
If it persists for minimum bar count (default 5), it upgrades to solid-border, brighter yellow - a validated zone.
If momentum drifts too far from where zone started (exceeds drift tolerance relative to zone height), the zone is invalidated and deleted. This prevents slow trends from being falsely labeled as consolidation.
When zone breaks (convergence conditions end), box color changes based on breakout direction: teal for bullish breakout, maroon for bearish breakout.
Only one active zone exists at a time to keep the chart clean.
How to Trade It
Validated consolidation zones (solid border) represent coiled momentum. Breakouts from these zones, especially when accompanied by IGNITION or THRUST phase, often produce strong directional moves. The breakout color immediately tells you the direction.
REVERSAL ATMOSPHERE - CURVATURE-BASED REVERSAL WARNING
A soft colored glow appears around the momentum line when mathematical curvature suggests a reversal is forming.
How It Works
The indicator calculates the second derivative of momentum (curvature - how the slope itself is changing).
Bullish reversal detection: Momentum is below zero (bearish), but slope has turned positive (rising), and curvature is positive (the rise is accelerating). This is the mathematical signature of a bottom forming - momentum is still negative but fighting back.
Bearish reversal detection: Mirror image. Momentum is above zero, but slope is negative and curvature is negative. A top is forming.
Visual Output
Green glow: Bullish reversal pressure building
Red glow: Bearish reversal pressure building
Glow intensity increases with curvature strength, normalized against 30-bar standard deviation
Glow width is configurable (default 8 units)
Important Clarification
This is purely mathematical analysis of the oscillator's own curvature. It does not incorporate order flow data, market depth, bid/ask spreads, or any external data source. The term "atmosphere" is a visual metaphor describing the glow effect, not a claim about market microstructure.
CHOPPY MARKET BACKGROUND - REGIME WARNING
When three conditions are all simultaneously true, the pane background turns gray:
Efficiency Ratio below choppy threshold (default 0.30)
ADX below choppy threshold (default 18)
Momentum inside dead zone
This gray background is a visual warning: "Market conditions are choppy. Momentum signals here are statistically less reliable. Consider waiting for cleaner conditions."
DASHBOARD - THE MOMENTUM WEATHER REPORT
A compact panel (position and size configurable) displaying five key readings:
PHASE
Current lifecycle phase name in corresponding color. Instantly shows where momentum is in its lifecycle.
BIRTH
DI spread acceleration status - is new momentum being created?
ACCELERATING (cyan) : Strong positive acceleration, momentum actively being born
BUILDING (green) : Moderate positive acceleration
QUIET (gray): No significant acceleration
DECELERATING (red): Negative acceleration, momentum creation slowing or reversing
FLOW
Directional bias with magnitude.
BULL : Bullish DI dominance. Number is DI spread (gap between +DI and -DI)
BEAR : Bearish DI dominance
FLAT : Momentum in dead zone, no meaningful directional bias
WEATHER
Overall assessment combining phase and vitality.
FAVORABLE (green): Active phase (IGNITION/THRUST/PRIME) with momentum outside dead zone. Conditions support directional trading.
CAUTION (orange): FADING phase, or PRIME with negative spread velocity. Trend may be exhausting.
UNFAVORABLE (red): DEAD phase or momentum in dead zone. Avoid directional strategies.
PRESSURE
Reversal pressure from curvature analysis.
BULLISH REV (green): Strong bullish reversal curvature
BEARISH REV (red): Strong bearish reversal curvature
BUILDING (cyan): Moderate reversal curvature forming
NONE (gray): No significant reversal pressure
COMPLETE SETTINGS REFERENCE
Core Momentum Oscillator
Fast ZLEMA Length (default 9): Fast moving average responsiveness. Lower = faster, noisier.
Slow ZLEMA Length (default 21): Baseline moving average. Gap between fast and slow produces momentum.
Signal Line Length (default 5): Smoothing period for signal line.
Momentum Smoothing (default 3): Additional noise reduction on raw momentum.
ATR Period (default 14): Normalization period for cross-instrument comparability.
Consolidation Zones
Show Consolidation Zones (default true): Toggle zone detection.
Histogram Sensitivity (default 1.0): How tight momentum-signal gap must be. Lower = stricter.
Slope Sensitivity (default 1.0): How flat momentum must be. Lower = stricter.
Minimum Bars (default 5): Shortest valid consolidation duration.
Drift Tolerance (default 0.4): Maximum directional drift before zone invalidation.
Regime Detection
Efficiency Ratio Period (default 10): Lookback for price efficiency calculation.
ER Smoothing (default 5): Smoothing to prevent rapid regime flipping.
Trend Threshold (default 0.4): ER above this = trending market.
Dead Zone Multiplier (default 0.5): Standard deviations defining the noise band.
Choppy ER Threshold (default 0.30): ER below this contributes to choppy warning.
Choppy ADX Threshold (default 18): ADX below this contributes to choppy warning.
Momentum Lifecycle
Show Lifecycle Band (default true): Toggle the colored phase band.
DI Calculation Length (default 14): Period for Gaussian-weighted +DI/-DI.
ADX Smoothing (default 14): ZLEMA smoothing on DX.
ADX Signal Length (default 5): EMA of ADX for crossover detection.
Ignition Window (default 4): Bars after DI cross qualifying for IGNITION.
State Inertia (default 2): Bars a phase must persist before official transition.
Ignition Accel Threshold (default 0.2): Minimum spread acceleration for IGNITION.
Ignition Velocity Threshold (default 0.3): Minimum spread velocity for IGNITION.
Thrust Velocity Threshold (default 0.5): Minimum spread velocity for THRUST.
ADX Surge Threshold (default 1.5): Minimum ADX rise over 3 bars for THRUST.
ADX Strong Threshold (default 20): ADX above this = strong trend (PRIME/FADING).
DI Spread Minimum (default 10): Minimum DI gap for PRIME confirmation.
Reversal Atmosphere
Show Reversal Atmosphere (default true): Toggle the curvature glow effect.
Glow Width (default 8): Visual width of atmospheric glow. Cosmetic only.
Display
Show Histogram (default true): Toggle momentum-signal histogram.
Show Momentum-Signal Fill (default true): Toggle shaded area between lines.
Show Choppy Background (default true): Toggle gray background warning.
Dashboard
Show Dashboard (default true): Toggle the weather report panel.
Dashboard Position (default Top Right): Panel location on chart.
Dashboard Size (default Small): Text size in panel.
Alerts
Alert on Ignition (default true): Notify when entering IGNITION phase.
Alert on Fading (default true): Notify when entering FADING phase.
Confirm on Bar Close (default true): Wait for bar close before firing alerts. Prevents false signals from intra-bar noise.
ALERTS
Two alert conditions target the most actionable lifecycle transitions:
IGNITION Onset
Fires when lifecycle enters IGNITION phase. Alert message includes directional bias (Bullish/Bearish), current ADX value, and how many bars since DI cross.
FADING Onset
Fires when lifecycle enters FADING phase. Alert message includes ADX value and current spread velocity.
Bar Close Confirmation
When enabled (default), alerts only fire after the bar closes. This prevents false alerts triggered by intra-bar price spikes that later reverse. Recommended to keep enabled for reliable signals.
RECOMMENDED TIMEFRAMES AND INSTRUMENTS
MLD works across all timeframes and instruments due to ATR normalization.
Default settings optimized for: Daily and 4-hour charts.
For lower timeframes (15m, 5m): Consider increasing Momentum Smoothing to 5 and State Inertia to 3 to filter noise.
For weekly charts: Default settings work without adjustment.
For highly volatile instruments (crypto, small caps): The adaptive thresholds automatically adjust. No manual tuning typically required.
For low-volatility instruments (bonds, some forex pairs): Consider reducing Dead Zone Multiplier to 0.3 for more sensitivity.
PRACTICAL EXAMPLE - MOMENTUM LIFECYCLE IN ACTION
Consider a stock range-bound for weeks. ADX reads 12. Traditional trend tools show nothing actionable.
Then +DI crosses above -DI. ADX is still 12. No traditional signal. But MLD detects that the DI spread is accelerating - the gap is not just opening, it is opening faster each bar. ADX has risen for two consecutive bars (waking up). The lifecycle band turns cyan: IGNITION. The dashboard shows BIRTH: ACCELERATING, WEATHER: FAVORABLE.
Over the next few bars, spread velocity increases. ADX surges upward. The band turns green: THRUST. The trend is confirmed and building.
ADX crosses above 20, continues rising, spread stays wide. Band turns deeper green: PRIME. This is the productive phase.
Eventually ADX peaks, starts falling, drops below its signal line. Spread velocity turns negative. Band turns orange: FADING. Dashboard shows WEATHER: CAUTION. Time to trail stops tightly.
ADX falls back below 20, momentum enters dead zone. Band turns gray: DEAD. The lifecycle is complete.
The value: MLD flagged IGNITION several bars before ADX would have signaled anything. It flagged FADING while ADX was still technically strong but deteriorating. This is the early detection advantage.
Chart Example 1:
BTC/USDT 5-minute is showing a classic FADING lifecycle : a bullish thrust peaked around 13:00–14:00, entered a validated consolidation zone, and is now visibly breaking down. The momentum line is curving sharply downward inside the yellow box, the band is orange (FADING), and FLOW has flipped to BEAR 17.9 : confirming the consolidation resolved bearishly, not bullishly. The earlier cyan IGNITION flash (~14:30) failed to sustain, overwhelmed by the dominant fading structure. The dashboard reads WEATHER: CAUTION, PRESSURE: NONE : no reversal energy building yet.
Chart Example 2:
BTC/USDT 15-minute is in DEAD phase with WEATHER: UNFAVORABLE : no tradeable momentum present. The dashboard tells the complete story: FLOW is FLAT meaning neither bulls nor bears have directional control, and PRESSURE is NONE meaning no reversal energy is building beneath the surface either. Despite BIRTH showing ACCELERATING, without flow direction or reversal pressure to back it up, the acceleration has no confirmed destination yet. Stand aside and wait for the lifecycle band to shift out of DEAD before committing.
WHAT MAKES THIS INDICATOR ORIGINAL
The originality lies in three specific innovations not present in standard ADX/DI implementations or common momentum oscillators:
DI Spread Acceleration Analysis
Standard tools measure the DI spread itself or track ADX thresholds. MLD applies derivative analysis - velocity and acceleration - to the spread, transforming a traditionally lagging measurement into a leading indicator of trend formation.
Gaussian-Weighted DI Calculation
Standard DI uses Wilder smoothing with equal weight to all bars. Gaussian decay weighting makes DI inherently more responsive to recent directional moves without the noise penalty of shorter periods.
Five-Phase Lifecycle Classification with Inertia-Gated State Machine
Rather than binary trend/no-trend output, MLD maps momentum onto a lifecycle model with distinct phases and specific mathematical criteria. The state machine prevents flickering while allowing speed-critical states (IGNITION, THRUST) to transition immediately.
These are integrated innovations, not independent indicators on the same pane. Each feeds into the lifecycle engine or provides context for its output.
DISCLAIMER
This indicator performs mathematical calculations on price data (open, high, low, close) only. It does not use order flow data, volume profile, market depth, bid/ask information, institutional positioning data, or any external data source.
Terms like "momentum birth," "reversal atmosphere," "weather," and " lifecycle " are descriptive metaphors for mathematical concepts (derivatives, curvature, efficiency ratios, state classification). They are not claims about market microstructure or participant behavior.
No indicator predicts future price movement. MLD identifies mathematical conditions historically associated with specific momentum behaviors. These conditions may or may not produce expected outcomes in any given instance.
This tool supplements - it does not replace - a complete trading plan including risk management, position sizing, and multiple forms of analysis. Always use proper risk management. Past indicator behavior does not guarantee future results. Индикатор

Double Momentum - DMOM | TR🎯 Overview
Double Momentum - DMOM | TR is an advanced momentum oscillator developed by Tiagorocha1989 that builds upon the classic momentum concept by applying the momentum calculation twice. This “momentum of momentum” approach amplifies trend signals, reduces lag, and helps traders identify acceleration and deceleration phases with greater clarity. The indicator offers dual‑mode operation (zero‑line or moving‑average crossovers), an extensive selection of moving average types, and rich visual customization to suit any trading style.
🔧 How It Works
Double Momentum enhances the standard momentum formula by taking the momentum of the momentum itself. This double calculation emphasises changes in the rate of price change, making it particularly effective for spotting trend strength and potential reversals early.
Core Calculation Logic:
First Momentum (MOM):
MOM = Current Price - Price n-periods ago
where n is the user-defined Length DMOM.
Double Momentum (DMOM):
DMOM = 2 × MOM - MOM of MOM
(i.e., DMOM = 2 × MOM - ta.mom(MOM, Length_DMOM))
This formula is reminiscent of a double exponential smoothing step—it reacts faster to changes in momentum while smoothing out noise.
Reference Line (Entry_DMOM):
The indicator compares DMOM to a reference line that can be either:
Zero Line (classic mode) – signals occur when DMOM crosses above or below zero.
DMOM MA (enhanced mode) – the reference line becomes a moving average of DMOM itself, providing smoother, filtered signals.
The moving average type and length are fully customizable, with support for 12 different MA variants (see Key Features).
The resulting oscillator oscillates around the chosen reference line:
DMOM above reference → upward acceleration (bullish momentum)
DMOM below reference → downward acceleration (bearish momentum)
Magnitude indicates the strength of the acceleration.
✨ Key Features
🔹 Dual Operating Modes
Zero Line Mode: Classic signals when DMOM crosses above or below zero – simple and intuitive.
DMOM MA Mode: Smoother signals when DMOM crosses its own moving average – reduces whipsaws in choppy markets.
🔹 Extensive Moving Average Selection
Choose from 12 MA types for the DMOM MA line, each with its own characteristics:
EMA, SMA, RMA, WMA, VWMA, HMA, DEMA, TEMA, TRIMA, FRAMA, SWMA, T3.
The T3 MA includes an adjustable T3 Factor for fine‑tuning smoothness.
🔹 Customizable Momentum Parameters
Length DMOM: Lookback period for both momentum calculations (default 36).
Source DMOM: Price source for the initial momentum (default Close).
🔹 Extended Range Visualization
Gradient fills are drawn between DMOM and the reference line, with fixed bounds at +30000 and -30000. These zones help visualise extreme readings, regardless of the instrument’s typical price level.
🔹 Customizable Color Themes
Eight distinct color schemes to match your chart aesthetics:
Classic, Modern, Robust, Accented, Monochrome, Moderate, Aqua, Cosmic
Each theme defines separate colors for bullish and bearish states.
🔹 Comprehensive Visual Feedback
Colored DMOM Line: Changes colour based on its position relative to the reference line.
Signal Line: Yellow line representing the zero or MA reference.
Gradient Fill Zones: Semi‑transparent fills showing extreme momentum areas.
Dynamic Zone Fills: Additional fill between DMOM and the reference line, coloured by the prevailing bias.
Color‑Coded Candles: Bars reflect the current DMOM bias (above or below reference).
Signal Markers: Triangle up/down symbols at crossover points.
Live Value Display: Current DMOM value shown in a floating label near the last bar.
Trend Table: Bullish/Bearish status displayed in a table on the chart.
🔹 Ready‑to‑Use Alerts
Built‑in alert conditions trigger LONG on bullish crossovers and SHORT on bearish crossunders, for both operating modes.
⚙️ Settings Summary
Setting Description Default
Color Choice Select from eight visual themes Classic
Length DMOM Lookback period for momentum calculations 36
Source DMOM Price source for momentum Close
Entry/Exit Signal Choose between zero‑line or DMOM MA mode 0
Length MA Moving average period for DMOM MA mode 365
Moving Average Type of moving average for the signal line (12 options) EMA
T3 Factor Factor for T3 moving average (0–1) 0.7
📈 Practical Applications
🔹 Trend Acceleration Detection
The slope and position of DMOM relative to the reference line quickly reveal whether price momentum is accelerating or decelerating. Steeply rising DMOM indicates strong bullish acceleration; steeply falling DMOM signals bearish acceleration.
🔹 Zero‑Line Crossovers
In Zero Line mode, crossovers provide clear signals:
Crossover above zero → bullish acceleration, potential trend reversal up.
Crossunder below zero → bearish acceleration, potential trend reversal down.
🔹 Signal‑Line Crossovers
In DMOM MA mode, crossovers between DMOM and its moving average generate filtered signals that work well in trending markets:
DMOM crosses above its MA → bullish signal.
DMOM crosses below its MA → bearish signal.
🔹 Divergence Trading
Double Momentum is excellent for spotting divergences:
Bullish Divergence: Price makes a lower low while DMOM forms a higher low → possible upside reversal.
Bearish Divergence: Price makes a higher high while DMOM forms a lower high → possible downside reversal.
Divergences are most reliable after extended trends or at extreme levels.
🔹 Momentum Confirmation
The magnitude of DMOM confirms trend strength:
Large positive values → strong bullish acceleration.
Large negative values → strong bearish acceleration.
Values nearing the reference line → momentum slowing, potential trend change.
🔹 Centerline Rejections
When DMOM approaches the reference line (zero or MA) but reverses before crossing, it can signal trend continuation – a common pattern in strong trends.
🔹 Multiple Timeframe Analysis
Compare DMOM readings across timeframes: higher‑timeframe DMOM defines the primary trend, while lower‑timeframe DMOM helps pinpoint entry and exit timing.
🎯 Ideal For
✅ Trend Traders seeking confirmation of trend strength and direction.
✅ Momentum Traders wanting an early view of acceleration and deceleration.
✅ Divergence Traders looking for leading reversal signals.
✅ Swing Traders capturing medium‑term momentum shifts.
✅ System Developers needing a robust, customisable crossover‑based strategy.
✅ Beginner Traders who appreciate clear visual signals and multiple learning modes.
📌 Key Takeaways
Double Momentum Logic: Applying momentum twice amplifies trend signals and reduces lag compared to standard momentum.
Dual‑Mode Flexibility: Choose zero‑line simplicity for clear entries or MA‑smoothed signals for filtered trades.
Unbounded Nature: Like standard momentum, DMOM has no upper/lower limits, making it suitable for strongly trending instruments.
Extensive MA Options: 12 moving average types give you complete control over the smoothness and responsiveness of the signal line.
Rich Visuals: Colour themes, gradient fills for extreme zones, candle colouring, and live value labels provide immediate market context.
Divergence Capability: The double calculation often reveals divergences earlier than simple momentum.
Alert‑Ready: Pre‑built alerts for both LONG and SHORT signals across both operating modes.
⚠️ Important Notes
Because DMOM is unbounded, its scale can vary significantly between instruments and timeframes. The gradient fills at ±30000 are arbitrary reference points and may not represent actual overbought/oversold conditions for all instruments.
The default Length DMOM of 36 offers a medium‑term perspective. Shorter lengths (9–14) produce more responsive signals, while longer lengths (e.g., 50–100) are better for identifying major trends.
The default Length MA of 365 in DMOM MA mode is designed for a long‑term context on daily charts; adjust it to match your trading horizon.
Divergences are most reliable when they occur after extended trends and are confirmed by other tools.
Always combine Double Momentum with proper risk management and additional confirmation before live deployment.
Disclaimer: This indicator is provided for educational and informational purposes only. Past performance does not guarantee future results. Always test thoroughly and align with your personal risk management strategy. Индикатор