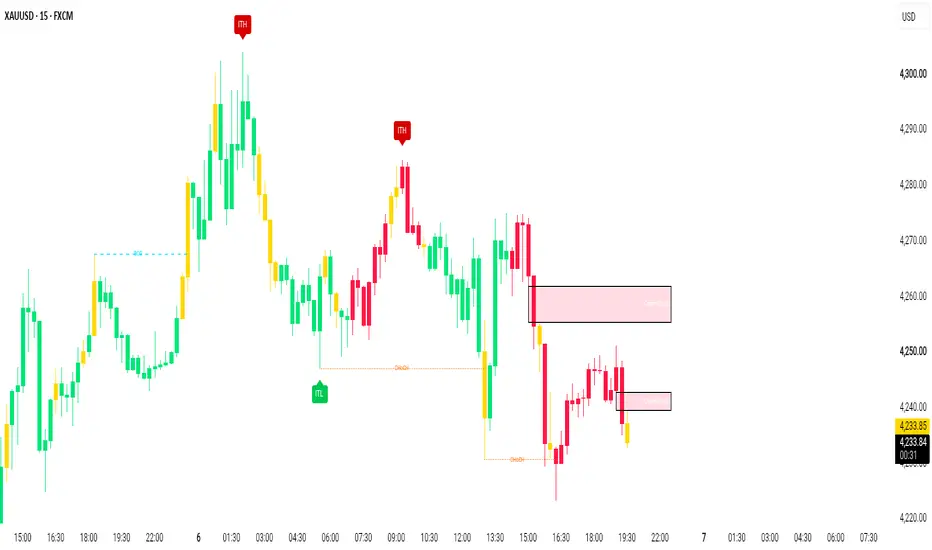
Trade Wzrd - Null Range [Rampage Series]✨ TRADE WZRD - NULL RANGE
Every range has two middles. The one price draws - the midpoint - and the one VOLUME draws: the exact price where everything traded inside the range nets to nothing. Half the participation above, half below. The balance point where the tug-of-war reads null .
Null Range plots that line, builds a channel out of volume's own deviation, and fades the pokes that venture beyond it - out where participation thins to nothing. Not a promise - a receipt.
⚡ THE RAMPAGE SERIES ⚡
Null Range is a release in the Rampage Series - a growing family of volume-and-levels tools built by Trade Wzrd. Every Rampage script ships with the same built-in automation layer: signals don't just paint, they speak. One alert, one webhook, and every entry, exit and fill fires a plain-text order string.
✨ THE NULL RANGE ✨
The dealing range's volume is distributed across a hundred invisible bins, and the 50/50 split becomes a single glowing line. Not a midpoint. Not an average. The price where the crowd's money actually nets to zero. And the line itself is the regime read: it runs CYAN when volume's center of mass sits in the cheap half, RED when it sits in the expensive half. Its right-edge tag carries VOL CENTER - the exact percentage. Hover it for the full story.
⚡ THE VOLUME CHANNEL ⚡
The same bins yield volume's standard deviation - so Null Range draws the channel where participation actually lives: two glowing sigma walls around the line with graded fills, and nothing else. ~95% of traded volume lives inside. Price beyond the wall is price out where volume goes null - extended, exhausted, and ripe for the trap.
✨ KINETIC FUEL ✨
Under the structure, a fuel strip burns: volume times speed, candle by candle, normalized against recent history. Bull fuel hangs off the discount wall in cyan, bear fuel off the premium wall in red - spike squares mark the bars that moved real mass, and WALL SLAM diamonds stamp the bars where that mass physically hit a wall. When a trap springs off a slam, the whole crowd pushed - and still failed.
⚡ THE MARGIN PROFILE ⚡
In the right margin, the range's own bins draw themselves quietly - spanning exactly wall to wall, because that's where the volume that matters lives. Every row is tinted by who owned that price: cyan where buyers dominated, red where sellers did. The Point of Control is ringed in gold. Width, offset, delta coloring - all yours. It's the same engine as the line, laid on its side.
✨ FLOW HEAT ✨
No labels. No lines. Just heat. When price sinks while buy pressure quietly rises, the tape washes faint cyan - someone is loading into weakness. When price rises while sell pressure builds, it washes faint red - someone is unloading into strength. The disagreement between pressure and price, painted as weather. The dashboard's FLOW HEAT row names the shift when it's live.
✨ THE FILTERS ✨
Trade only what the database believes in. Min Win Probability skips signals from cold buckets (once they have enough samples to judge - TRACKING signals always pass). Max Extension skips blow-off pokes. Balance Alignment demands volume's center be on your side. Every active filter shows on the dashboard's FILTERS row, so you always know what the engine is allowed to take.
✨ THE TRAP ✨
The signal: price pokes beyond the two-sigma wall - out into the null - and closes back inside within the trap window. The fakeout. Fade it back toward the line - the default target IS the null range itself, because mean-reversion trades deserve mean-reversion targets. Premium traps short from above, discount traps long from below. EQ Reclaim mode (decisive crosses back through the line, 0.2 ATR minimum, no whipsaw) is there for continuation players.
⚡ THE CONVICTION SCORE ⚡
Here is where Null Range stops asking for trust. Every signal carries one compact number - CONVICTION - that no single ingredient could give you. Underneath it sits this chart's own live database: traps bucketed by how deep the extension ran (0–0.25, 0.25–0.5, 0.5–1.0, 1.0+ ATR beyond the wall), reclaims bucketed by whether volume's center was on their side. That historical win rate is the base - then the score bends with the scenario: volume's center on your side or against you, a tidy poke or a blow-off, a spike bar or thin air. History + balance + depth + fuel, fused into one grade from 5 to 95. Early on, before the buckets earn their samples, the score runs on structure alone - and says so.
And the hover is REACTIVE . Point at any signal and the verdict breaks the score into its parts: the conviction line, thin-sample warnings when a bucket is young, hot/cold bucket verdicts, depth-risk notes on blow-off extensions, balance alignment with the crowd's cost basis, and a fuel read on the participation behind the poke. Same model, different situation, different answer.
✨ THE RECEIPTS ✨
Signals stay on the chart as compact conviction chips - ▲ T 72, ▼ R 64 - one glance, one grade. Every closed trade stamps ✓ TP HIT or ✗ SL HIT exactly where it died. The dashboard tracks the VOL CENTER and PRICE POS gauges, the regime word, EQ/POC/channel width, the last signal with its conviction, the FLOW HEAT state, the database total, and a 10-dot streak row. The trade box carries entry, dashed stop, solid target with live R:R - and the conviction rides inside the entry tag.
⚡ YOURS TO SHAPE ⚡
Every visible piece answers to you: walls on or off, the line gradient or solid, EQ and POC tags toggleable, POC width, profile width and offset, delta colors or one solid tone, fuel strip, slam markers, flow heat, channel fills. The defaults are the house look - the knobs are all yours.
⚡ BUILT-IN AUTOMATION ⚡
One alert ("Any alert() function call") + your webhook URL, and Null Range speaks TradeWzrd order strings:
⚡ Entries with SL/TP prices attached
⚡ Optional opposite-signal close prepended to new entries
⚡ TP/SL-hit close alerts that mirror the on-chart trade box
The same readable comma syntax drives automation across 7+ platforms - percent-risk or fixed-volume sizing, magic numbers, order comments. No lock-in: plain text, any endpoint.
✨ HOW TO READ IT ✨
⚡ One glowing line = where the range's volume nets to null. Cyan = volume built low, red = volume built high
⚡ The graded channel = where ~95% of the volume lives. Price outside the wall = out in the null, extended
⚡ Fuel candles below/above the walls = kinetic energy per bar; squares = spike bars; diamonds = wall slams, mass meeting structure
⚡ Faint cyan/red wash behind the tape = flow heat: pressure and price disagreeing
⚡ The quiet profile in the margin, wall to wall = who owns each price: cyan rows buyers, red rows sellers, gold ring POC
⚡ ▲ T / ▼ T chips = the trap just failed - the number is conviction: this chart's track record bent by balance, depth and fuel. Hover for the breakdown
⚡ ▲ R / ▼ R chips = decisive reclaims of the line, same conviction engine
⚡ Dashboard: gauges, regime, FILTERS row, FLOW HEAT row, DATABASE row (trap and reclaim rates separately), streak dots
⚡ HOW TO USE ⚡
⚡ Drop it on any liquid symbol, 5m to 4H - tuned defaults for XAUUSD 15m
⚡ Let it run. The database is empty at first - conviction runs on structure alone until the buckets earn their samples
⚡ Compare buckets: if shallow traps earn 70% and deep ones earn 40%, you know exactly which pokes to take
⚡ Wire one alert when you're ready to automate
✨ LIMITATIONS ✨
⚡ Conviction starts from this chart's own history, bucketed - a sample, not a promise. Small samples lie confidently; the hover tells you when a bucket is young
⚡ The database resets when you change symbols, timeframes, or core settings - every context earns its own track record
⚡ Traps fade extensions - in a runaway trend, the outer wall keeps getting hit and the trap window is the honest filter
⚡ On symbols without volume data, the line falls back to midpoint and sigma to range/4
✨ CREDITS ✨
Kinetic fuel concept inspired by "Kinetic Momentum Vectors" by BigBeluga (CC BY-NC-SA 4.0). Concept only and Null Range's fuel is re-engineered from zero: volume times speed, burning off our own volume-channel walls. No code or geometry shared with the original.
Rift maps WHERE the volume traded. Null Range knows WHERE THE VOLUME NETS TO NOTHING - and what fading the void has been worth.
Educational shell. Not financial advice. Not a signal service. Индикатор

ATK / DEF Advanced Battle Engine## Overview
ATK / DEF Advanced Battle Engine is a market behavior analysis and visua tool that combines liqui conditions, price movement, volati behavior, and swing struc to provide a mu-dimenal reference around signcant price highs and lows.
Raher than trting price movement as a simple upward or downward ratio, this indicator examines how liquidity conditions and price movement inract with one anoer around swing points.
The ATK / DEF concept is used as a structural repsentation of changing market behavior. It is not inteed to repsent a conntional direcnal indicator or a simple adce/dine measement.
## Core Concept
The indicator combines several market observations into a unied analytical framework:
• Swing High and Swing Low structure
• Liquidity pressure
• Liquidity changes
• Price movement behavior
• ADL-based tracking
• ADL directional behavior
• ADL attraction characteristics
• Volatility conditions
• Combined behavior assessment
The purpose of combining these components is to provide additional context around hw price behaves when it rches or develops around important high and low areas.
Instead of evating a high or low from prie alone, the indicator considers the surrnding liqity and movement conditions at the se time.
## High & Low Behavior
Swing High and Swing Low points form the structural foution of the indicator.
When a high or low is idenied, the indicator displays additional contextal information associed with that location, including the current ADL tracking condition and liquidity pressure.
This creates a layered view of each structural point.
A high is therefore not trted simply as a numical pric leel, and a low is not treed simpl as an isolaed turing point.
The surroding conditions are displayd together to provide a broader represtation of the behavior occring around that area.
## Liquidity Analysis
Liquidity information is reprented through two primary observions:
### Liquidity Pressure
Liquidity Pressure compares the current volume condition with its corresnding average levl.
The result is normalized into a bounded rae and classied into dferent pressure levls.
This provides a reference for identiing whether the current market envirment is operating under relatily higher, normal, or lower liqdity conditions.
### Liquidity Change
Liquidity Change exanes the change in volume conditions across a dened period.
It provides a reference for whether liquidity conditions are incasing, decasing, or remning relavely balanc.
These measements are used as conttual information raer than as stalone directional measuments.
## ADL Tracking
The ADL Tracking component evaates the relaonship between price change and changs in volume conditions.
The resuing value is normalized into a range and categized into several intensity levels.
This allows the indicator to reprent the current relatiohip between price movement and liquidity conditions without reducing the analysis to price direction alone.
The displayed levels provide a visua reference for changes in the inteity of this relationship.
## ADL Trend
ADL Trend measures the change in the ADL tracking condition over a dened period.
It classifies the observed behavior as:
• Up
• Down
• Sideways
The associated strgth value proides additional context rerding the magtude of the oerved change.
This component is intended to describe the changing state of the undeying measurement rather than simply deribing whether price is risg or faing.
## ADL Attraction
ADL Attraction examines the difference between the ADL-based movement component and the unrlying price-change component.
The resulting value is smoothed and normalized to provide a serate referce for directional pressure within the combed calculan.
The indicator presents this condition through:
• Direction
• Strength
• Intensity level
This helps distinguish the behavior of the combined liquidity/price relationship from the raw movement of price itelf.
## Volatility Behavior
Volatility Behavior compares the current candle range with ATR-based volatility conditions.
The result provides a normalized reprentation of the relative size of the current price range.
The indicator classifies volatility into several levels, allowing users to distiuish between relatively qut price behavior and periods with greater range expansion.
Volatility is presented as contextual information alongside liquidity and structural observations.
## Behavior Detection
The Behavior Detection component combines ADL Tracking and ADL Attraction into a single reference value.
This produces a brder repsentation of the conditions being obrved by the indicator.
The resulting classifation provides a simplified summary of the combined measurements while retaining the underlying components in the analysis table.
It should be viewed as a composite reference rather than a standalone directional measurement.
## ATK / DEF Framework
The ATK / DEF terminogy describes two sies of market behavior around structural price areas.
**ATK** reprsents the obsvation of upward-side interaction around relevant high-side structure.
**DEF** reprsents the obseration of downward-side interaction around relevant low-side structure.
These tems are usd as visal and structural laels for intpreting the relatiship between price, liqdity, and swing behavior.
They do not represent direct market instructions.
## Analysis Table
The intated analysis table prides a compact view of the current analytical state.
It includes:
• ADL Tracking
• ADL Trend
• ADL Attraction
• Liquidity Pressure
• Liquidity Change
• Volatility Behavior
• Behavior Detection
The table allows the different measurements to be vied togher rather than interpreting each component independently.
## Swing Labels
When ebled, Swing High and Swing Low labels display the strtural price level together with contextual liquidity and ADL information.
This allows histical swing locations to rein addtional analycal information instead of displaying only the price level.
The result is a more detaled visual reprentation of how liqdity and price behavior were charterized around the detected structural area.
## Design Philosophy
The design of ATK / DEF Advanced Battle Engine is based on combining multle forms of market information rather than relng on a single measurement.
Price strture provides the location.
Liquidity provides conttual participation information.
ADL calculaons provide a relaonship between price movement and volume conditions.
Volatity provides information about the sce of current price movement.
Together, these components create a multi-layer reference for stud market behavior around highs, lows, and chaing structural conditions.
## Important Note
This indicator is intended for market behavior analysis and visual reference.
It is not designed as a stalone desion-mag sysm. The displayed measuments should be evalted together with other anatical tools, market contet, and indendent intertation.
The values and classiations are callated from historal price and volume da and may chang as new mat dat devels.
Histor behavior does not guara future conditions.
ATK / DEF Advanced Battle Engine is designed to provide additional analytical
Индикатор

Индикатор

Risk Sizer### Risk Sizer
**Risk Sizer** is a fast position-sizing and execution-risk tool designed for discretionary intraday and breakout trading.
Instead of choosing a position size first, place the draggable **SL** at the level where your trade idea is invalidated. Risk Sizer then calculates the position size based on your account risk while accounting for trading costs and execution conditions.
The indicator displays:
* **REC QTY** — liquidity-adjusted recommended position size
* **RISK QTY** — maximum size based on your configured risk
* **POSITION** — recommended position notional
* **SL** — stop price and percentage distance
* **ATR** — ATR for the current chart timeframe
* **SL / ATR** — stop distance relative to current volatility
* **BUFFER** — configurable slippage/execution allowance
* **RT FEES** — estimated round-trip trading fees
* **FEE / SL** — how significant fees are relative to the stop distance
* **RISK USED** — estimated total risk versus your configured risk budget
* **CAP USED** — percentage of the configured maximum position limit
* **1M LIQ** — average 1-minute notional volume used as a liquidity proxy
* **LIQ MULT** — suggested size reduction when the position is large relative to observed volume
* **EXECUTION** — simple green / amber / red execution warnings
### Position sizing
Position size accounts for:
**Structural SL + execution buffer + estimated round-trip fees**
This helps prevent extremely tight stops from producing unrealistically large position sizes.
For example, if your stop is only `0.01%` but your round-trip trading costs are `0.08%`, fees are already significantly larger than the structural stop. Risk Sizer highlights this through the **FEE / SL** metric and includes those costs when determining size.
### Liquidity-adjusted sizing
Risk Sizer also calculates an optional liquidity recommendation using average **1-minute TradingView notional volume**.
If your risk-based position would represent more than your configured target percentage of average 1-minute volume, the indicator reduces the recommended size and shows the resulting **LIQ MULT**.
Example:
```text
RISK QTY 100 ETH
LIQ MULT 0.40x
REC QTY 40 ETH
```
The risk-based quantity remains visible so you can distinguish between:
**Risk capacity** — how much you could trade based on your stop and risk budget.
**Execution capacity** — a more conservative recommendation based on observed market activity.
### Execution status
The indicator classifies conditions into simple execution warnings.
**Green — OK**
No obvious sizing or execution issue detected.
**Amber — Review**
* High fees relative to SL
* Very tight or wide SL relative to ATR
* Liquidity-based size reduction
* Position notional cap reached
**Red — Attention**
* Round-trip fees exceed the structural SL percentage
* Invalid or impractical calculated position size
### Typical workflow
**1. Identify the trade setup**
**2. Drag SL to structural invalidation**
**3. Check EXECUTION status**
**4. Read REC QTY**
**5. Execute**
The indicator is intentionally designed for quick visual use during fast-moving markets.
### Important limitations
The liquidity model is a **proxy**, not an order-book or slippage prediction.
It uses TradingView's available 1-minute volume data and does not know the actual depth, spread, liquidity-provider inventory, or execution quality available at your broker or exchange.
Actual fills may differ due to:
* Spread
* Order-book depth
* Market impact
* Latency
* Volatility
* Slippage
* Broker/exchange execution
* Fees and instrument specifications
Fees, quantity increments, point value, maximum notional and liquidity thresholds are configurable and should be adjusted to match the instrument and venue you trade.
**Risk Sizer is an execution and risk-management aid, not a trading signal or financial advice.**
Индикатор

Индикатор

Tubbsie's Chop Warning Indicator**Chop Warning**
A simple, at-a-glance indicator that tells you whether the market is trending cleanly or chopping sideways around a moving average — the kind of environment where breakouts fail, stops get hunted, and most trend-following setups don't work.
**How it works**
The indicator picks a reference EMA (13 by default) and counts how often each candle's high–low range contains that EMA. When price is trending, most candles sit cleanly above or below the moving average and the count stays low. When price is chopping, the EMA sits inside candle after candle and the count rises.
Two views are reported side by side:
- **Rolling** — the percentage of crosses over the last N candles, showing what's happening right now
- **Session** — the percentage across the whole trading session, showing the character of the day as a whole
Both figures appear in a small on-chart table, colour-coded green (clean), amber (mixed), or red (choppy). A single verdict line at the top summarises the current state in plain English.
**Settings**
Everything is configurable: EMA length, rolling window size, the two thresholds that define "clean" and "choppy", which view drives the warning (rolling, session, or either), the session window and timezone, table position and size, colours, and optional background shading when a warning is active. Alerts fire when chop is detected and when the market cleans up again.
**How to use it**
Works on any market and any timeframe. Add it to your chart alongside your existing setup and treat a red verdict as a filter — a signal to stand aside, reduce size, or wait for the environment to improve before taking a trend-based trade.
Индикатор

Alpha Trend Hunter | PropTraderzOverview
Alpha Trend Hunter is an overlay trend-analysis indicator designed to identify directional transitions by requiring agreement between two independent components:
a custom smoothed synthetic price structure derived from OHLC data;
an ATR-based SuperTrend filter.
The indicator does not generate a Buy or Sell label from either component independently.
A signal is created only when both modules agree on direction and the combined directional state changes.
The intended workflow is therefore:
Price Smoothing → Synthetic Trend Direction → Volatility Trend Confirmation → Directional Signal
The underlying concepts of exponential moving averages, synthetic Heikin-Ashi-style calculations, ATR and SuperTrend are established technical-analysis concepts. The implementation focuses on combining them into a two-stage confirmation framework intended to reduce isolated directional transitions that are not supported by both price structure and volatility-adjusted trend.
1. Smoothed OHLC Foundation
The first stage of the indicator applies an exponential moving average independently to:
Open
High
Low
Close
The default smoothing period is:
14 bars
This creates four smoothed OHLC series:
smoothed open;
smoothed high;
smoothed low;
smoothed close.
The purpose of this initial stage is to reduce some of the short-term noise present in raw candles before the synthetic trend structure is calculated.
A larger HA Period produces more smoothing and slower reactions.
A smaller HA Period keeps the synthetic structure closer to raw price and therefore makes it more responsive.
2. Custom Synthetic Heikin-Ashi-Style Structure
After the OHLC series are smoothed, the script calculates a synthetic typical value:
Synthetic Typical =
(Smoothed Open + Smoothed High + Smoothed Low + Smoothed Close) / 4
A recursive synthetic open is then calculated.
On initialization:
Synthetic Open =
(Smoothed Open + Smoothed Close) / 2
After initialization:
Synthetic Open =
(Previous Synthetic Open + Previous Synthetic Typical) / 2
This recursive calculation creates a smoother directional structure that carries information forward from previous bars.
It should be understood as a custom Heikin-Ashi-style synthetic calculation, rather than the standard Heikin Ashi candle series supplied directly by TradingView.
3. Synthetic High and Low
The script constructs synthetic upper and lower values using the smoothed high/low together with the synthetic open and synthetic typical value.
Synthetic High
The maximum of:
smoothed high;
synthetic open;
synthetic typical.
Synthetic Low
The minimum of:
smoothed low;
synthetic open;
synthetic typical.
These values define the working synthetic price range used by the trend-line calculation.
4. Synthetic Mid-Line
The midpoint of the synthetic range is calculated as:
Mid-Line = Synthetic Low +
(Synthetic High − Synthetic Low) / 2
This is equivalent to the midpoint between the custom synthetic high and low.
The mid-line is then smoothed again using an EMA.
The default secondary smoothing length is:
2 bars
The result is plotted as the primary visible trend line.
5. Trend-Line Direction
The color of the main trend line is determined by the relationship between:
synthetic open;
synthetic typical price.
Bullish synthetic structure
When:
Synthetic Open < Synthetic Typical
the structure is interpreted as bullish.
Bearish synthetic structure
When:
Synthetic Open > Synthetic Typical
the structure is interpreted as bearish.
The trend line therefore provides a continuous visual representation of the direction calculated from the custom synthetic price series.
6. Secondary Smoothing
The Smooth parameter controls the final EMA applied to the synthetic midpoint.
Default:
2
Lower value
Produces:
faster trend-line response;
closer tracking of short-term movement;
potentially more directional changes.
Higher value
Produces:
smoother trend line;
slower reaction;
stronger filtering of small changes.
This parameter affects the displayed synthetic trend line.
It is separate from the HA Period used to smooth the original OHLC values.
7. SuperTrend Confirmation Filter
The second major component is TradingView's ATR-based SuperTrend calculation.
The SuperTrend uses two user-configurable parameters:
ATR Period
Factor
Default values:
ATR Period = 2
Factor = 2.0
SuperTrend constructs volatility-adjusted trailing boundaries around price.
The active trend direction changes when price moves sufficiently through the corresponding volatility boundary.
8. SuperTrend Direction
The script interprets the SuperTrend direction as:
Bullish
stDir < 0
Bearish
stDir > 0
The active bullish or bearish SuperTrend line is plotted independently.
A lightly shaded area between candle midpoint and the active SuperTrend boundary provides additional visual context.
9. ATR Period
The ATR Period controls how quickly the volatility measurement reacts to changing market conditions.
The default value is relatively short:
2 periods
Smaller ATR Period
Generally creates:
faster volatility adaptation;
more responsiveness to recent price movement.
Larger ATR Period
Generally creates:
smoother ATR values;
slower adaptation;
less sensitivity to individual short-term volatility changes.
Because the default setting is intentionally responsive, users should test longer ATR periods when applying the indicator to noisier instruments or lower timeframes.
10. SuperTrend Factor
The Factor controls the distance of the SuperTrend boundary from price.
Conceptually:
SuperTrend distance ∝ ATR × Factor
Therefore:
Lower Factor
Generally produces:
tighter SuperTrend boundaries;
faster trend changes;
more frequent directional transitions;
increased sensitivity to noise.
Higher Factor
Generally produces:
wider boundaries;
slower trend changes;
fewer transitions;
stronger filtering of smaller price movements.
So, similar to the Sensitivity concept in the previous indicators:
Higher Factor = generally fewer/slower SuperTrend transitions.
Lower Factor = generally more/faster transitions.
11. Dual-Confirmation Signal Logic
Signals require directional agreement between the synthetic price structure and SuperTrend.
Bullish agreement
A bullish state exists when:
synthetic open is below synthetic typical;
AND SuperTrend is bullish.
In simplified form:
Synthetic Bullish + SuperTrend Bullish = Long State
Bearish agreement
A bearish state exists when:
synthetic open is above synthetic typical;
AND SuperTrend is bearish.
In simplified form:
Synthetic Bearish + SuperTrend Bearish = Short State
Neither condition alone produces a signal.
12. Buy Signals
A Buy label appears when the indicator transitions into a new bullish agreement state.
This requires:
bullish synthetic trend;
bullish SuperTrend;
the combined bullish condition was not active on the previous bar;
the previous stored signal state was not already bullish.
Once the bullish state is recorded, repeated Buy labels are suppressed until the indicator first transitions into the opposite directional state.
This prevents the indicator from printing a Buy label on every bullish candle.
13. Sell Signals
A Sell label follows the inverse logic.
It requires:
bearish synthetic trend;
bearish SuperTrend;
a new bearish agreement state;
the previous stored state not already being bearish.
The persistent signal-state variable therefore allows the indicator to mark directional transitions rather than continuous conditions.
14. Why Two Trend Components Are Used
The two components measure trend differently.
Component Main role
Smoothed OHLC Reduces raw candle noise
Synthetic structure Measures directional price relationship
Synthetic trend line Visualizes smoothed structural direction
ATR/SuperTrend Volatility-adjusted trend confirmation
State engine Prevents duplicate signals
Buy/Sell labels Marks changes in confirmed direction
The synthetic component is derived primarily from smoothed price structure.
SuperTrend is driven by price plus volatility.
Requiring agreement therefore attempts to avoid treating a change in either calculation alone as sufficient confirmation.
15. Example Bullish Interpretation
Suppose the synthetic trend changes bullish.
That condition alone does not immediately require a Buy label.
The indicator also evaluates SuperTrend.
If SuperTrend remains bearish, the two systems disagree and no bullish signal is generated.
When both eventually satisfy:
Synthetic Trend = Bullish
and
SuperTrend = Bullish
a new bullish combined state can generate a Buy signal.
This structure is intended to filter some early synthetic transitions that occur before volatility-adjusted trend confirmation.
16. Example Bearish Interpretation
The same process applies inversely.
A bearish synthetic trend is insufficient by itself.
The SuperTrend direction must also be bearish.
Once both components agree and the indicator transitions from its previous state, a Sell signal can be displayed.
17. Signal Frequency
Signal frequency depends primarily on three parameters.
HA Period
Controls initial OHLC smoothing.
Higher values generally produce slower synthetic directional changes.
Smooth
Controls final smoothing of the synthetic midpoint trend line.
Higher values produce a smoother displayed trend line.
SuperTrend Factor
Controls volatility-boundary distance.
Higher values generally require a larger price movement before SuperTrend changes direction.
Because these parameters affect different parts of the framework, they should not be interpreted as interchangeable sensitivity controls.
18. Suggested Starting Parameters
The default configuration is:
HA Period: 14
Smooth: 2
ATR Period: 2
Factor: 2.0
These values provide a relatively responsive configuration.
Users working with particularly noisy instruments or very short timeframes may wish to test:
longer HA Periods;
longer ATR Periods;
larger SuperTrend Factors.
Users wanting faster response can experiment with smaller values.
No parameter combination is universally optimal.
19. Trend Line vs Signal
The main synthetic trend line and the Buy/Sell signals should not be interpreted as the same feature.
The trend line continuously reflects the synthetic structure.
Signals require additional SuperTrend agreement.
Therefore, the trend line can change directional state before a Buy or Sell label appears.
This difference is intentional.
20. Alerts
The indicator provides two alert conditions:
Buy Signal
Sell Signal
The Buy alert corresponds to a new bullish combined state.
The Sell alert corresponds to a new bearish combined state.
Alerts indicate only that the programmed conditions have been met.
They do not constitute independent trade recommendations.
21. Real-Time Behavior
The indicator evaluates information from the currently developing candle.
Consequently, conditions can evolve while a live candle is still open.
For traders who require confirmed signals, the safest interpretation is to evaluate the signal after the corresponding chart candle has closed.
The indicator should therefore not be marketed as universally non-repainting without additional restrictions or testing.
Historical conditions are naturally evaluated using completed bars, while a live candle can still change before closure.
22. No Higher-Timeframe Data Dependency
The current version does not request external symbols or higher-timeframe series.
Its calculations are based on the OHLC and volatility information of the chart on which it is applied.
This makes the indicator simpler than a multi-timeframe framework, but its behavior will still differ substantially according to the selected chart timeframe.
23. Timeframe Considerations
On lower timeframes:
market noise is greater;
synthetic trend changes may occur more frequently;
short ATR periods are more reactive;
SuperTrend reversals can occur more often.
On higher timeframes:
signals generally develop more slowly;
each transition represents a larger amount of underlying price movement.
Parameter values should therefore be evaluated independently for each timeframe and market.
24. Limitations
Alpha Trend Hunter is a reactive trend indicator.
It does not predict future price.
The underlying calculations use:
historical price;
current price;
moving averages;
ATR;
recursive synthetic values.
These calculations inherently react after price information becomes available.
A stronger degree of smoothing generally decreases noise but also increases lag.
25. Sideways-Market Limitation
The indicator is fundamentally trend-oriented.
During sideways or rapidly alternating conditions, both synthetic trend calculations and SuperTrend can produce repeated directional transitions.
The dual-confirmation requirement can reduce some isolated changes, but it cannot eliminate whipsaw risk.
The indicator does not contain a dedicated ADX or market-regime filter in its current version.
26. Risk Management
The indicator does not calculate:
position size;
account risk;
stop-loss placement;
reward/risk targets;
portfolio exposure.
Users must determine risk independently.
A Buy or Sell label indicates only a transition in the indicator's defined directional state.
27. What Alpha Trend Hunter Does Not Do
Alpha Trend Hunter does not:
execute orders;
connect to a brokerage account;
manage positions;
guarantee profitable signals;
predict exact tops or bottoms;
guarantee trend continuation;
identify institutional activity;
determine appropriate leverage;
determine individualized risk.
It is a technical-analysis and trend-visualization tool.
28. Intended Use
A practical workflow is:
use the synthetic trend line to observe the underlying smoothed direction;
observe the SuperTrend volatility regime;
wait for agreement between both components;
use the Buy/Sell transition as confirmation that a new combined state has formed;
evaluate market structure and personal risk independently before making any trading decision.
The indicator is designed to answer:
“Are smoothed price structure and volatility-adjusted trend currently pointing in the same direction?”
rather than:
“Will the next trade be profitable?”
Educational Purpose
Alpha Trend Hunter is intended for technical analysis, research and educational use.
Users should independently consider:
price structure;
volatility;
liquidity;
economic events;
timeframe;
execution conditions;
risk management.
Historical signals do not guarantee future results. Индикатор

DNSE VN301!, Bollinger Bands Break Out Strategy "Bollinger Bands Breakout with SMA Trend Filter" is a volatility breakout strategy designed to capture strong directional price movements when price breaks outside its recent trading range. The strategy uses Bollinger Bands, constructed from an SMA(20) and two standard deviations, to identify bullish breakouts when price closes above the upper band and bearish breakouts when price closes below the lower band.
To improve signal quality, the strategy incorporates an optional SMA(200) trend filter, allowing Long trades only when the SMA is rising and Short trades only when it is falling. By combining volatility-based breakout signals with long-term trend confirmation, the strategy seeks to reduce false breakouts during ranging markets while participating in sustained intraday trends. It also includes configurable stop loss, take profit, trading session filters, automatic end-of-day position closure, and trend reversal exits for disciplined risk management.
Strategy settings and configuration:
Chart timeframe: recommended 5-minute chart
Position size: 3 contracts
Bollinger Bands length: 20
Bollinger Bands multiplier: 2.0
SMA length: 200
Stop loss: 10 points
Take profit: disabled
SMA trend filter: On / Off
Take profit: On / Off
Time filter: On / Off
Trading session: 09:00 – 14:30
Trade direction: Long / Short / Both
Default script settings:
The strategy calculates Bollinger Bands using the SMA(20) of the closing price. The upper and lower bands are created by adding or subtracting two standard deviations around the middle line.
When volatility increases, the Bollinger Bands expand. When the market is quiet or moving sideways, the bands contract.
When the closing price breaks above the upper Bollinger Band, buying pressure may be taking control. When the closing price breaks below the lower Bollinger Band, selling pressure may be taking control.
When the SMA(200) trend filter is enabled, the script only allows Long trades when SMA(200) is rising and only allows Short trades when SMA(200) is falling. When the SMA filter is disabled, the strategy can trade both directions based only on Bollinger Bands breakout signals.
Users can add the built-in Bollinger Bands indicator on TradingView with Length 20 and Multiplier 2.0 to visually monitor the signal on the price chart.
Entry and exit rules:
Long entry:
Closing price > upper Bollinger Band
AND SMA(200) is rising, if the SMA filter is enabled
AND the signal appears during the trading session
AND trade direction allows Long entries
Long exit:
Stop loss: 10 points from entry price
Take profit: disabled by default
Closing price touches or breaks below the lower Bollinger Band
SMA(200) turns downward, if the SMA filter is enabled
Reversal when a valid Short signal appears
Automatic position close at the end of the trading session
Short entry:
Closing price < lower Bollinger Band
AND SMA(200) is falling, if the SMA filter is enabled
AND the signal appears during the trading session
AND trade direction allows Short entries
Short exit:
Stop loss: 10 points from entry price
Take profit: disabled by default
Closing price touches or breaks above the upper Bollinger Band
SMA(200) turns upward, if the SMA filter is enabled
Reversal when a valid Long signal appears
Automatic position close at the end of the trading session
Risk disclaimer:
Futures trading involves a high level of risk and prices can move sharply. This script is provided for reference, research, and backtesting purposes only. Users should fully understand derivatives trading, their own risk tolerance, and the strategy logic before applying it to live trading.
All investment decisions are the responsibility of the user. phaisinh.online is not responsible for any losses arising from the use of this strategy in real trading. Past performance does not guarantee future results.
____________________________________________________________________
"Bollinger Bands Breakout với Bộ lọc Xu hướng SMA" là một chiến lược giao dịch theo xu hướng dựa trên sự bứt phá của biến động giá, được thiết kế nhằm nắm bắt các chuyển động mạnh theo một hướng khi giá vượt ra khỏi vùng dao động gần nhất. Chiến lược sử dụng Bollinger Bands, được xây dựng từ SMA(20) và 2 độ lệch chuẩn, để xác định tín hiệu mua khi giá đóng cửa vượt lên trên dải trên và tín hiệu bán khi giá đóng cửa xuống dưới dải dưới.
Để nâng cao chất lượng tín hiệu, chiến lược tích hợp bộ lọc xu hướng SMA(200) (có thể bật hoặc tắt), chỉ cho phép mở vị thế Long khi SMA đang dốc lên và vị thế Short khi SMA đang dốc xuống. Bằng cách kết hợp tín hiệu bứt phá theo biến động của Bollinger Bands với xác nhận xu hướng dài hạn, chiến lược hướng tới việc giảm thiểu các tín hiệu phá vỡ giả trong giai đoạn thị trường đi ngang, đồng thời tận dụng các xu hướng intraday kéo dài. Ngoài ra, chiến lược còn bao gồm các tùy chọn Stop Loss, Take Profit, bộ lọc khung thời gian giao dịch, cơ chế tự động đóng toàn bộ vị thế khi kết thúc phiên, cùng với điều kiện thoát lệnh khi xu hướng SMA đảo chiều, nhằm đảm bảo quản trị rủi ro một cách chặt chẽ và có kỷ luật.
Cài đặt & cấu hình chiến lược:
Biểu đồ: khuyến nghị khung 5 phút
Khối lượng giao dịch: 3 hợp đồng
Chu kỳ Bollinger Bands: 20
Hệ số nhân Bollinger Bands: 2.0
Chu kỳ SMA: 200
Cắt lỗ: 10 điểm
Chốt lời: tắt
Bộ lọc xu hướng SMA: Bật / Tắt
Dùng chốt lời: Bật / Tắt
Bộ lọc giờ: Bật / Tắt
Khung giờ giao dịch: 09:00 – 14:30
Chiều giao dịch: Mua / Bán / Cả hai
Cài đặt mặc định của script:
Chiến lược tính toán Bollinger Bands dựa trên đường SMA(20) của giá đóng cửa. Dải trên và dải dưới được tạo bằng cách cộng hoặc trừ hai độ lệch chuẩn quanh đường giữa.
Khi biến động tăng mạnh, hai dải Bollinger Bands sẽ mở rộng. Khi thị trường đi ngang hoặc biến động thấp, hai dải sẽ co hẹp lại.
Khi giá đóng cửa vượt lên trên dải trên Bollinger Bands, lực mua có thể đang chiếm ưu thế. Khi giá đóng cửa phá xuống dưới dải dưới Bollinger Bands, lực bán có thể đang chiếm ưu thế.
Khi bật bộ lọc xu hướng SMA(200), script chỉ cho phép lệnh Mua khi SMA(200) dốc lên và chỉ cho phép lệnh Bán khi SMA(200) dốc xuống. Khi tắt bộ lọc SMA, chiến lược có thể giao dịch cả hai chiều chỉ dựa trên tín hiệu breakout của Bollinger Bands.
Người dùng có thể thêm chỉ báo Bollinger Bands có sẵn trên TradingView với tham số Length 20 và Multiplier 2.0 để quan sát tín hiệu trực quan trên biểu đồ giá.
Điều kiện vào và thoát lệnh:
Vào lệnh Mua:
Giá đóng cửa > dải trên Bollinger Bands
VÀ SMA(200) dốc lên, nếu bật bộ lọc SMA
VÀ tín hiệu xuất hiện trong khung giờ giao dịch
VÀ chiều giao dịch cho phép lệnh Mua
Thoát lệnh Mua:
Cắt lỗ: 10 điểm từ giá vào lệnh
Chốt lời: không dùng theo mặc định
Giá đóng cửa chạm hoặc phá xuống dải dưới Bollinger Bands
SMA(200) đảo chiều xuống, nếu bật bộ lọc SMA
Đảo chiều khi xuất hiện tín hiệu Bán hợp lệ
Tự động đóng lệnh khi hết khung giờ giao dịch
Vào lệnh Bán:
Giá đóng cửa < dải dưới Bollinger Bands
VÀ SMA(200) dốc xuống, nếu bật bộ lọc SMA
VÀ tín hiệu xuất hiện trong khung giờ giao dịch
VÀ chiều giao dịch cho phép lệnh Bán
Thoát lệnh Bán:
Cắt lỗ: 10 điểm từ giá vào lệnh
Chốt lời: không dùng theo mặc định
Giá đóng cửa chạm hoặc phá lên dải trên Bollinger Bands
SMA(200) đảo chiều lên, nếu bật bộ lọc SMA
Đảo chiều khi xuất hiện tín hiệu Mua hợp lệ
Tự động đóng lệnh khi hết khung giờ giao dịch
Tuyên bố rủi ro:
Giao dịch hợp đồng tương lai có mức độ rủi ro cao và giá có thể biến động mạnh. Script này chỉ phục vụ mục đích tham khảo, nghiên cứu và kiểm thử. Người dùng cần hiểu rõ giao dịch phái sinh, khẩu vị rủi ro cá nhân và logic của chiến lược trước khi áp dụng vào giao dịch thực tế.
Mọi quyết định đầu tư thuộc trách nhiệm của người dùng. phaisinh.online không chịu trách nhiệm cho bất kỳ khoản lỗ nào phát sinh từ việc sử dụng chiến lược này trong giao dịch thực tế. Hiệu quả trong quá khứ không đảm bảo kết quả trong tương lai.
Стратегия

Market Correlation Visualizer (Z-Score)Market Correlation Visualizer (Z-Score & % Var)
OVERVIEW
The Market Correlation Visualizer is a multi-asset analysis tool designed for intraday traders and quant analysts. Instead of relying on static correlation tables, this script plots real-time relative performance across up to 8 benchmark assets (Indices, Volatility, Commodities, Bonds, and Crypto) directly on your chart panel.
By standardizing assets through either Z-Score (Standard Deviations) or Percentage Change, you can instantly spot institutional imbalances, intermarket divergences, and statistical overextensions before they manifest on price action alone.
KEY FEATURES
Dual Engine Calculation:
Z-Score Normalization scales price movements based on rolling standard deviation. It identifies when an asset is statistically overbought/oversold relative to its peers.
Daily % Change Anchor normalizes performance from a customizable anchor time (e.g. Daily Open) to track pure percentage strength or weakness throughout the session.
Smart Right-Hand Labels:
Clean, dynamic labels automatically lock onto the right boundary of the indicator panel, displaying the ticker name and exact current reading. No need to memorize line colors.
Statistical Excess Zones (+/- 2.0 SD):
Visual upper and lower threshold bands immediately highlight extreme mean-reversion zones when using Z-Score mode.
Selective Visibility Filters:
Toggle up to 8 custom symbols on or off directly from the settings menu to keep your workspace uncluttered.
Error-Handled Security Fetching:
Built with robust fallback logic to ensure smooth performance across various brokers without breaking the chart panel if a specific ticker fails to load.
HOW TO USE FOR INTRADAY TRADING
Spotting SMT / Intermarket Divergences:
Watch key correlated pairs (e.g. ES vs NQ). If one index makes a new high while the visualizer line on the other fails to confirm, a liquidity sweep or SMT divergence is in play.
Mean-Reversion & Arbitrage:
When an asset crosses outside the +/- 2.0 Standard Deviation band while others remain neutral, it indicates an overextended asset prone to snapping back toward the zero-line.
Volatility Confirmation:
Track VIX against equity futures (ES, NQ). If ES hits a new low but the VIX line fails to push upward, the selling momentum lacks institutional backing.
DEFAULT TICKERS INCLUDED
Asset 1: TVC:VIX (Volatility)
Asset 2: CME_MINI:ES1! (S&P 500)
Asset 3: CME_MINI:NQ1! (Nasdaq 100)
Asset 4: COMEX:GC1! (Gold)
Assets 5 to 8 (Optional): NYMEX:CL1! (Crude Oil), CBOT:ZB1! (30Y Bonds), CME_MINI:RTY1! (Russell 2000), BINANCE:BTCUSDT (Bitcoin).
All inputs can be fully customized in the script settings. Индикатор

EWS - Anchored VWAP IndicatorVWAP — Daily / Weekly / Monthly
Three independently anchored volume weighted average prices on one chart. Each
one resets on the first tick of a new day, week and month, so you always see
where the daily, weekly and monthly volume has actually been transacted rather
than a single rolling average.
WHAT IT DOES
VWAP is the average price of every trade in a period, weighted by size. It is
the reference price large orders are measured against, which is why price so
often gravitates back to it. A daily VWAP tells you who is winning the session,
a weekly VWAP frames the swing, and a monthly VWAP marks the level that
positional money is anchored to. Having all three at once shows you when they
stack up (trend) and when they pinch together (compression before expansion).
Each VWAP is accumulated bar by bar from the raw price and volume of the chart
you are on. Nothing is smoothed, averaged again, or borrowed from a higher
timeframe request, so there is no repainting and no lag beyond the data itself.
ANCHORING
The whole point of a periodic VWAP is where it resets, so the anchor is
configurable rather than assumed.
Session (exchange) resets when TradingView opens a new daily, weekly or monthly
bar. This respects the symbol's real session, so a futures day correctly begins
at 18:00 the previous evening and a stock day begins at the opening bell. This
matches the behaviour of the built-in VWAP.
Calendar resets at 00:00 in a timezone you choose: the exchange timezone, UTC,
or any IANA timezone you type in. This is normally what you want on 24/7 crypto,
where there is no session and the market convention is a UTC day.
Pick the mode that matches how you actually think about the instrument. For
crypto, Calendar UTC. For futures, FX and equities, Session.
FEATURES
Daily, weekly and monthly VWAP, each with its own colour, line width and
on/off switch.
Optional standard deviation bands on any of the three, with a configurable
multiplier and a shaded fill. The deviation is volume weighted from the same
accumulator as the VWAP itself, not a simple standard deviation of price.
Show only the current period. Hides every completed day, week and month and
draws just the anchors that are still building. Useful when you only trade the
live level and want the history out of the way.
Auto-hide. A daily VWAP on a daily chart is just the bar itself, so anchors
that are meaningless on the current timeframe are hidden automatically. Can be
turned off.
Line breaks at each reset, so you do not get a vertical spike connecting the
end of one period to the start of the next.
Value labels at the right edge showing the live price of each VWAP.
Alerts for price crossing the daily, weekly or monthly VWAP.
Selectable source, defaulting to hlc3, which is the standard VWAP price.
NOTES
The indicator needs real volume. If the symbol's data feed provides none, it
will tell you instead of silently drawing a flat line. Some index and CFD style
tickers have no volume; use an exchange specific ticker in that case.
Values update on every tick. When a new period begins, the reset happens on the
first tick of that period's first bar. You do not have to wait for a bar to
close.
This is a reference and context tool, not a signal generator. VWAP tells you
where value is, not which way price is going next. Use it to frame entries,
size risk against a level, and judge whether a move is extended, and combine it
with your own method rather than trading crosses on their own.
Индикатор

CORTEX MULTI-TIMEFRAME POI ENGINE# CORTEX MULTI-TIMEFRAME POI ENGINE
The CORTEX MULTI-TIMEFRAME POI ENGINE is a rules-based TradingView indicator designed to identify, qualify, and manage supply-and-demand Points of Interest across multiple structural timeframes.
Rather than marking every pivot, opposing candle, or conventional order block, CORTEX applies a structured qualification process built around confirmed market structure, consolidation quality, displacement, retracement depth, imbalance, liquidity proxies, and breaker-block behavior.
## Multi-Timeframe Market Structure
CORTEX organizes market location into three distinct layers:
- **Daily POIs** establish higher-timeframe macro location.
- **H4 POIs** identify intermediate structural areas.
- **M15 and M5 AM-session POIs** support intraday refinement on NQ and ES.
Daily, H4, M15, and M5 layers are independently controlled, allowing traders to reduce chart clutter and focus only on the context relevant to their current workflow.
## POI Qualification
A standard CORTEX POI progresses through an objective detection pipeline:
1. Meaningful retracement
2. Compressed base formation
3. Institutional Footprint Candle refinement
4. Directional displacement
5. Mandatory break of structure
6. Liquidity and imbalance evaluation
7. Width and location validation
8. Transparent quality scoring
9. Confirmed zone creation
Break of structure is mandatory. Additional characteristics contribute to a configurable quality score rather than relying on unexplained probability claims.
Available qualification modes include:
- **Loose** for broader structural identification
- **Balanced** for the recommended combination of quality and frequency
- **Strict** for selective, higher-confluence zones
- **Custom** for complete user control
## Breaker-Block Fusion
The engine includes an independently developed ICT breaker-block module.
A potential order block becomes a breaker only after a later confirmed candle closes through its opposite boundary. Wick-only violations do not qualify.
Breaker blocks may:
- Create standalone breaker POIs
- Add confluence to existing supply or demand zones
- Merge with overlapping, same-direction POIs
- Refine the final area to the valid price intersection
- Increase the zone’s score without exceeding 100
Merged areas are classified as **Breaker-Confluent POIs**, helping distinguish ordinary structural zones from areas supported by a confirmed failed-block transition.
## CORTEX AM Session POI Layer
The intraday module is designed specifically for NQ and ES during the default **08:00–11:00 America/New_York** session.
It provides:
- M15 POIs on M15 and M5 charts
- M5 POIs on M5 charts
- Automatic daylight-saving adjustment
- Automatic NQ and ES futures-root recognition
- Optional manual instrument override
- Confirmed post-session BOS allowance
- Independent demand, supply, timeframe, and display controls
Mandatory default width limits are:
- **NQ: 250 ticks**
- **ES: 40 ticks**
Zone width is calculated using the instrument’s native minimum tick size. Candidates exceeding the applicable limit are rejected before publication.
## Transparent Scoring
Each POI receives an objective score from 0 to 100. Depending on the selected mode and timeframe, the score may incorporate:
- Confirmed BOS
- Base quality
- Retracement depth
- Departure strength
- Liquidity sweep
- Fair-value gap or imbalance
- Resting-liquidity proxy
- Breaker-block confluence
Scores and classifications can be displayed directly on zone labels and in the Data Window.
## Zone Lifecycle Management
Every confirmed POI is actively managed through the following lifecycle:
- **Fresh**
- **Tested**
- **Mitigated**
- **Invalidated**
- **Expired**
Users can configure mitigation and invalidation behavior, retain invalidated zones for historical review, and control how long intraday zones remain available.
## Non-Repainting Design
CORTEX uses confirmed source-timeframe information for zone creation.
Higher-timeframe results are transported using confirmed historical offsets, preventing unfinished Daily, H4, M15, or M5 candles from publishing premature zones. A confirmed POI may be anchored to its original footprint candle, but it does not become logically active before its qualifying structure is complete.
This deliberate confirmation delay is intended to support stable behavior across:
- Historical charts
- Realtime execution
- TradingView Bar Replay
## Diagnostics and Alerts
The CORTEX diagnostics dashboard reports:
- Latest qualification stage
- Signals detected
- Candidates awaiting BOS
- Width-filter rejections
- Breaker flips
- Zones retained
- Session status
- Detected instrument
- Applicable tick limit
- Chart-timeframe compatibility
Alerts are available for new POIs, breaker zones, confluence, first tests, mitigation, and invalidation. Alerts should be configured for **Once Per Bar Close**.
## Intended Workflow
CORTEX is designed to support a top-down process:
1. Use Daily zones to establish macro location.
2. Use H4 zones to refine structural context.
3. Use M15 zones for intraday directional areas.
4. Use M5 zones for lower-timeframe refinement.
5. Evaluate price behavior at qualified zones rather than treating every zone as an automatic entry.
CORTEX does not claim to identify actual institutional orders. Supply, demand, liquidity, imbalance, and breaker classifications are objective technical proxies derived from price action.
This indicator is an analytical framework—not financial advice or a guarantee of future performance. Traders should combine it with appropriate confirmation, risk management, and independent judgment. Индикатор

Institutional SMC & Order Flow Matrix PROInstitutional SMC & Order Flow Matrix PRO
Institutional SMC & Order Flow Matrix PRO is a clean, modern, and highly versatile technical charting tool engineered for traders practicing Smart Money Concepts and Order Flow Trading. Built with a focus on visual clarity, it eliminates unnecessary chart clutter by utilizing auto mitigating execution zones, swing anchored market structure lines, and an intelligent trend heatmap.
Key Features Overview
1. Precision Anchored Market Structure
Tracks Break of Structure and Change of Character signals with extreme precision. Lines originate directly from actual swing high or low pivot prices, while structure text labels sit neatly in the center of lines to prevent candle overlap.
2. Smart Auto Mitigating Order Block Zones
Automatically maps active institutional order blocks and imbalance execution zones. Mitigated zones automatically vanish from your chart once price fills the imbalance, keeping your workspace clean and professional.
3. Institutional Candle Heatmap
Features dynamic candlestick coloring driven by macro structural pivots. Bullish trend phases render in clean vibrant green, bearish phases in deep red, and high momentum displacement candles highlight in glowing gold.
4. Major Intermediate Term High and Low Badges
Automatically detects macro structural extremes. Displays solid red Intermediate Term High badges at major resistance tops and green Intermediate Term Low badges at major support bottoms.
5. Complete Manual Customization Suite
Includes comprehensive user settings for every element. Customize line styles, line thickness, border widths, box transparency, text alignment, text colors, and font sizes.
How to Use
Step 1: Identify Macro Trend Bias
Observe the Institutional Candle Heatmap theme to quickly determine current directional order flow.
Step 2: Monitor Centered Structure Signals
Look for precise Break of Structure lines and Change of Character signals anchored directly from swing points.
Step 3: Spot Gold Displacement Candles
Identify gold highlighted expansion candles that create fresh institutional order blocks.
Step 4: Trade Active Execution Zones
Utilize unmitigated bullish and bearish order block zones for high probability entries.
Settings Overview
Market Structure Settings
- Show Market Structure: Toggle structural line displays.
- Line Style and Thickness: Choose between Solid, Dashed, or Dotted lines with adjustable width.
Order Block Zone Settings
- Show Active Order Blocks: Toggle order block rectangles.
- Zone Fill Transparency: Adjust fill opacity from 0 to 100.
- Zone Text Settings: Customize display text, text alignment, font size, and text color.
Major Pivot Settings
- Show Major ITH / ITL Badges: Toggle visibility of macro pivot badges.
- Sensitivity: Adjust pivot lookback sensitivity.
Candle Heatmap Settings
- Enable Trend Candle Heatmap: Toggle dynamic trend candles and gold displacement highlights.
Disclaimer
This indicator is built strictly for educational, analytical, and charting enhancement purposes. It does not provide financial advice, trade recommendations, or guaranteed results. Always apply proper risk management principles. Индикатор

[Kpt-Ahab] Poor Man's Orderflow Simple AlgoPilotImportant Notice and Risk Warning
The published settings were selected solely based on historical data for the asset and timeframe shown.
The displayed result may be random or over-optimized and cannot automatically be transferred to other assets, timeframes, or future market conditions. Even with the presented settings, the strategy may cause significant losses at any time, including the complete loss of the allocated strategy capital.
This script is intended exclusively for analysis and testing purposes. It does not constitute investment advice or a trading recommendation.
Description
This script uses reused and adapted code components from ** Auto RiskManagement & Backtest System 2.1b** and the ** Poor Mans Orderflow Simulator **.
These components have been combined into a standalone strategy that integrates simplified orderflow signals with position management, risk management, and backtesting functions.
How It Works
The strategy uses a simplified approximation of orderflow. It evaluates the relationship between candle body size and candle range, relative volume, candle direction, and recurring absorption and impulse events.
It does not use actual bid/ask, footprint, Level 2, or order book data.
Depending on the selected signal mode, direct breakouts, confirmed absorption clusters, impulse candles, or combinations of these conditions may generate long and short signals.
Position and Risk Management
The script supports, among other features:
* Long and short positions
* Fixed or trailing stop-loss levels
* Multiple partial profit targets
* Breakeven after the first profit target
* Optional additional entries
* Further entries may also be disabled after the specified total number of losing trades has been reached or when the maximum permitted drawdown is exceeded.
* Internal or external trading signals
* Automatic parameters based on asset class and timeframe
Additional entries and simulated leverage may significantly increase the risk of loss.
Backtest Limitations
Strategy Tester results are based exclusively on historical market data. Real-world results may differ significantly due to commissions, spreads, slippage, liquidity, price gaps, and execution delays.
Past performance is not a reliable indication of future results.
Position Closing Settings
The **Open Position Signals** setting determines how new signals are handled while a position is already open:
* **Wait-End-Deal:** All indicator signals are ignored until the current position has ended.
* **Wait-Signal-Close:** Only explicit signals for closing a long or short position are processed.
* **Wait-Reversal:** An opposing entry signal may also close the current position.
Several closing conditions are available for the integrated orderflow logic. For example, a position may be closed by an opposing impulse, a combination of a cluster and an impulse, or a confirmed opposing entry signal.
Further trading may also be restricted after a specified number of losing trades or when the maximum permitted drawdown is reached.
Trailing Stop, Breakeven, and Liquidation Line
The strategy supports both a fixed stop-loss and a trailing stop. The selected percentage represents the direct price distance from the average entry price and is not automatically adjusted by the simulated leverage.
In trailing mode, the stop is only moved in a direction that is favorable to the position. If the average entry price changes due to an additional entry, the existing stop is adjusted accordingly.
The stop may optionally be moved to the average entry price after the first profit target has been reached. A stop mode must be enabled for this function to operate.
The displayed liquidation line is only an internal estimate based on the simulated position and account values. It may differ significantly from the actual liquidation calculation used by a broker or exchange.
Using External Indicators
An external numerical signal source may be used instead of the integrated Poor Man’s Orderflow Simulator.
The external indicator must provide a selectable plot series containing the following values:
* **+1:** Long or buy signal
* **−1:** Short or sell signal
* **+2:** Close short position
* **−2:** Close long position
All other values, including `na`, produce no new signal.
The external indicator must output the required numerical values through a selectable plot. This plot can then be selected under **External Source**.
Whether and how an external signal is processed while a position is open also depends on the selected **Open Position Signals** setting.
-----------------------------------
Wichtiger Hinweis und Risikowarnung
Die veröffentlichten Einstellungen wurden ausschließlich anhand historischer Daten für das dargestellte Asset und den verwendeten Zeitrahmen gewählt.
Das Ergebnis kann zufällig oder überoptimiert sein und lässt sich nicht automatisch auf andere Assets, Zeitrahmen oder zukünftige Marktphasen übertragen. Auch mit den dargestellten Einstellungen kann die Strategie jederzeit erhebliche Verluste verursachen und das eingesetzte Strategiekapital vollständig verlieren.
Dieses Skript dient ausschließlich zu Analyse- und Testzwecken und stellt keine Anlageberatung oder Handelsempfehlung dar.
Beschreibung
Dieses Skript verwendet wiederverwendete und angepasste Codebestandteile aus Auto RiskManagement & Backtest System 2.1b und dem Poor Mans Orderflow Simulator .
Die Komponenten wurden zu einer eigenständigen Strategie verbunden, die vereinfachte Orderflow-Signale mit Positions-, Risiko- und Backtestfunktionen kombiniert.
Funktionsweise
Die Strategie verwendet eine vereinfachte Annäherung an Orderflow. Sie wertet das Verhältnis von Kerzenkörper und Handelsspanne, relatives Volumen, Kerzenrichtung sowie wiederkehrende Absorptions- und Impulsereignisse aus.
Dabei werden keine echten Bid-/Ask-, Footprint-, Level-2- oder Orderbuchdaten verwendet.
Abhängig vom gewählten Signalmodus können direkte Ausbrüche, bestätigte Absorptionscluster, Impulskerzen oder Kombinationen dieser Bedingungen Long- und Short-Signale erzeugen.
Positions- und Risikomanagement
Das Skript unterstützt unter anderem:
Long- und Short-Positionen
feste oder nachlaufende Stop-Loss-Marken
mehrere Teilgewinnziele
Breakeven nach dem ersten Gewinnziel
optionale zusätzliche Einstiege
Drawdown-Begrenzung und Begrenzung nach einer festgelegten Anzahl an Verlusttrades
interne oder externe Handelssignale
automatische Parameter nach Assetklasse und Zeitrahmen
Zusätzliche Einstiege und ein simulierter Hebel können das Verlustrisiko deutlich erhöhen.
Einschränkungen des Backtests
Die Ergebnisse des Strategietesters basieren ausschließlich auf historischen Kursdaten. Reale Ergebnisse können durch Gebühren, Spread, Slippage, Liquidität, Kurslücken und Ausführungsverzögerungen erheblich abweichen.
Vergangene Ergebnisse sind kein verlässlicher Hinweis auf zukünftige Ergebnisse.
Schließungseinstellungen
Über **Open Position Signals** wird festgelegt, wie neue Signale während einer bereits geöffneten Position behandelt werden:
* **Wait-End-Deal:** Alle Indikatorsignale werden bis zum Ende der Position ignoriert.
* **Wait-Signal-Close:** Nur ausdrückliche Signale zum Schließen einer Long- oder Short-Position werden berücksichtigt.
* **Wait-Reversal:** Zusätzlich kann ein entgegengesetztes Einstiegssignal die aktuelle Position schließen.
Für die integrierte Orderflow-Logik stehen verschiedene Schließungsbedingungen zur Verfügung. Eine Position kann beispielsweise durch einen gegensätzlichen Impuls, eine Kombination aus Cluster und Impuls oder ein bestätigtes entgegengesetztes Einstiegssignal geschlossen werden.
Zusätzlich kann der weitere Handel nach einer festgelegten Anzahl an Verlusttrades oder beim Erreichen des maximal erlaubten Drawdowns begrenzt werden.
Trailing-Stop, Breakeven und Liquidationslinie
Die Strategie unterstützt einen festen Stop-Loss sowie einen nachlaufenden Trailing-Stop. Der eingestellte Prozentwert beschreibt dabei den direkten Abstand zum durchschnittlichen Einstiegspreis und wird nicht automatisch durch den simulierten Hebel verändert.
Im Trailing-Modus wird der Stop nur in eine für die Position günstigere Richtung nachgezogen. Verändert sich der durchschnittliche Einstiegspreis durch einen zusätzlichen Einstieg, wird auch der bestehende Stop entsprechend angepasst.
Optional kann der Stop nach dem Erreichen des ersten Gewinnziels auf den durchschnittlichen Einstiegspreis verschoben werden. Hierfür muss ein Stop-Modus aktiviert sein.
Die angezeigte Liquidationslinie ist lediglich eine interne Schätzung auf Basis der simulierten Positions- und Kontowerte. Sie kann deutlich von der tatsächlichen Liquidationsberechnung eines Brokers oder einer Börse abweichen.
Verwendung externer Indikatoren
Anstelle des integrierten Poor-Man’s-Orderflow-Simulators kann eine externe numerische Signalquelle verwendet werden.
Hierfür muss der externe Indikator eine auswählbare Plot-Serie mit den folgenden Werten ausgeben:
* **+1:** Long- beziehungsweise Kaufsignal
* **−1:** Short- beziehungsweise Verkaufssignal
* **+2:** Short-Position schließen
* **−2:** Long-Position schließen
Bei allen anderen Werten oder bei `na` wird kein neues Signal ausgeführt.
Der externe Indikator muss die benötigten Zahlenwerte direkt über einen auswählbaren Plot bereitstellen. Anschließend wird dieser Plot unter **External Source** ausgewählt.
Ob und wie ein externes Signal während einer geöffneten Position verarbeitet wird, hängt zusätzlich von der gewählten Einstellung unter **Open Position Signals** ab. Стратегия

Volatility Cone & Analog Path ProjectionVolatility Cone & Analog Path Projection — Forward Price Envelope with Fractal Replay and Terminal Probability Distribution
Overview
Nearly every overlay on TradingView describes the past: where price has been, where volume traded, where structure broke. This tool points in the other direction. It builds a forward projection zone from the current bar using three independent layers — a realized-volatility cone, a replay of the historically most similar price fractals, and a terminal probability profile that combines both into a distribution of possible outcomes at the projection horizon.
The result is not a forecast. It is a bounded expectation: a visual answer to "given how this instrument has actually been moving, what range is normal over the next N bars, and where has price historically ended up after conditions that looked like this?"
Conceptual Framework
Price uncertainty grows with the square root of time, not linearly. A 24-bar projection is not 24 times as wide as a 1-bar projection — it is roughly 4.9 times as wide. Traders who size targets and stops on a straight-line mental model consistently misjudge what is achievable in a given number of bars.
The cone makes that curvature visible. Its width at each future bar is sigma * sqrt(t), where sigma is the standard deviation of log returns over the volatility window. Three nested bands are drawn, so you can immediately see which targets sit inside the ordinary range, which sit at the statistical edge, and which would require an exceptional move.
The Gaussian model alone, however, is a poor description of real markets: returns have fat tails, and volatility clusters. The analog layer addresses this by ignoring models entirely and asking an empirical question instead — what actually happened, historically, after the market printed this exact shape?
How It Works
Volatility estimation. Log returns are computed bar to bar. Their standard deviation over the volatility window gives the per-bar sigma; their mean gives the drift. Drift can be included or excluded from the cone's centerline.
Cone construction. For each future bar t from 1 to the horizon, the upper and lower bounds are close * exp(drift*t ± k*sigma*sqrt(t)) for each of the three band multipliers. Each band is rendered as a closed polygon with layered transparency, producing depth from the centerline outward.
Fingerprint extraction. The most recent N bars of log returns are z-scored — mean removed, divided by their own standard deviation. This makes the pattern scale-invariant: the same shape is recognised whether it happened during a quiet range or a volatile expansion, and at any price level.
Historical scan. Every candidate window inside the scan depth is z-scored the same way and compared to the current fingerprint by summed squared difference. Lower distance means a closer shape match. Candidates that overlap an already-selected match without improving on it are rejected, so the top results are not five copies of the same event shifted by one bar.
Forward replay. For each of the top matches, the bars that followed it are converted into a relative path and re-anchored to the current close. The path each analog is drawing forward is exactly the move that occurred after that historical fingerprint — nothing is fitted or optimised. Paths ending above the current price are drawn bullish, below bearish, and a thick median line traces the bar-by-bar median across all analogs.
Terminal probability profile. At the projection horizon a horizontal distribution is built across the cone's full range. Each row's density blends the Gaussian probability implied by the volatility model with an empirical kernel centred on each analog's endpoint. The Model Weight input controls that mix: 1.0 is purely theoretical, 0.0 is purely historical, and the default sits between them. The widest row — the mode of the blended distribution — is marked as the most probable zone.
Interpretation
Cone bands define what is statistically ordinary. A target beyond the outer band within the horizon is not impossible, it is simply rare — treat it accordingly when planning holding time.
Cone width itself is information. A narrow cone means compressed volatility, which historically resolves into expansion. A wide cone means the market is already moving; chasing inside it carries a worse risk profile.
Analog dispersion matters more than analog direction. Five paths that fan out in all directions means the current shape carried no historical edge. Five paths clustering in one direction is the meaningful configuration.
Best Match Quality in the panel scores how closely the nearest historical fingerprint resembles the present one. Below roughly 60%, treat the analog layer as noise and rely on the cone alone.
The most probable zone is where the blended distribution peaks. It is a magnet-style reference, not a target — the distribution is wide by construction.
Volatility Regime compares short-window volatility to the full window. Expanding means the cone is likely to understate near-term movement; contracting means the opposite.
Settings
Setting Effect
Projection Horizon Bars projected forward. Also the endpoint of the profile
Volatility Window Sample size for sigma and drift. Longer = smoother, slower to adapt
Include Drift Tilts the cone with the window's mean return
Inner / Mid / Outer Band Sigma multipliers for the three layers
Fingerprint Length Bars compared for similarity. Shorter = more matches, less specific
Scan Depth How far back to search for analogs
Number of Analogs How many historical paths to replay
Profile Rows / Width Resolution and horizontal size of the terminal distribution
Model Weight Gaussian versus empirical blend in the distribution
Redraw on Bar Close Only Recommended on. The scan is heavy; this runs it once per bar
Limitations — read this
This is not a prediction and must not be traded as one. The cone describes a statistical range under an assumption of stable volatility. Real volatility is not stable, and returns have fatter tails than the Gaussian model implies, so moves outside the outer band occur more often than the model suggests.
Analog matching is weak evidence. A few dozen bars of shape similarity is a small sample; markets are non-stationary and a pattern that resolved one way in the past carries no obligation to repeat. The paths are historical context, not a probability statement about the future.
Nothing repaints, but the whole projection is recomputed each bar. Yesterday's cone is not preserved — the drawing always reflects current data only. It is anchored to the last bar by design.
On low-volume, illiquid, or heavily gapped instruments the return distribution is distorted and both layers degrade.
No entries, no stops, no targets, no signals. This is a context tool for sizing expectations and holding time. Индикатор

Smart Trend Filter Confirmation [MarkitTick]💡 A confirmed-bar trend-following system that fuses a volatility-adaptive trailing band with a six-condition consensus filter, designed to suppress the false flips that plague standard trend-following tools when markets stall, chop, or thin out. Rather than reacting to every band cross, the script cross-examines each potential signal against stall detection, slope strength, volume participation, range compression, basis-point movement, and trend strength (ADX) before allowing a flip to display — while retaining a breakout override so genuinely explosive moves are never suppressed by the very filters designed to catch noise.
✨ Originality and Utility
Trailing-band trend systems (Chandelier-style or SuperTrend-style constructs) are common on TradingView, but nearly all of them share the same weakness: the trailing line flips direction on every price crossover, regardless of whether that crossover reflects a genuine change in market character or simply noise generated during a stalled, illiquid, or compressing market. This script's originality lies in the "Regime Consensus" layer built on top of the adaptive trailing band. Six independent, mathematically distinct filters — measuring band stall, linear-regression slope, relative volume, historical range percentile, basis-point velocity, and ADX-based trend strength — are computed every bar. If any single filter flags a "flat" regime, the display direction is held at its last confirmed state instead of flipping, which materially reduces whipsaw signals in ranging conditions. A dedicated breakout override simultaneously monitors for abnormally large single-bar moves (measured in ATR multiples) and forces the flip through regardless of filter status, ensuring the system does not become sluggish during genuine volatility expansion. This combination — adaptive smoothing of the source price, a volatility- and momentum-weighted dynamic band, a multi-factor flat-market veto, and a breakout bypass — is not a simple mashup of stock indicators but an integrated decision layer where each component directly informs whether the others are permitted to act. The trend line, filters, override, and dashboard are not separable add-ons; they operate as a single signal-gating pipeline.
🔬 Methodology and Concepts
● Adaptive Source Smoothing
Before any band math is applied, the script conditions the underlying HL2-style source price using one of two selectable adaptive filters:
Kalman Filter — a recursive estimator that maintains an internal "belief" about the true price and a corresponding uncertainty (error covariance). Each new bar, the filter computes a gain factor from the ratio of predicted uncertainty to total uncertainty (predicted plus measurement noise, set by the Kalman R input) and blends the new price observation into its estimate proportionally. A higher Kalman Q input allows the estimate to adapt faster to new prices; a higher Kalman R input makes the filter trust new observations less, producing a smoother but slower-reacting line.
LLAMA (an adaptive-length moving average inspired by Kaufman's Efficiency Ratio concept) — measures how efficiently price has moved over the lookback window by comparing net directional change to the sum of all bar-to-bar movement (an efficiency ratio between 0 and 1). This ratio is squared into a smoothing constant that continuously shifts the moving average's responsiveness between a fast EMA-like constant and a slow EMA-like constant, so the average tightens to price during clean directional runs and widens during choppy conditions.
• Dynamic Volatility Band
The core trailing band's half-width is not a fixed ATR multiple. It is calculated from three weighted components: a base multiplier, an ATR-based term scaled by the ATR Weight input, and a normalized recent-price-movement term (capped at its own 95th percentile to prevent single outlier bars from distorting the band) scaled by the Move Weight input. This composite value is then multiplied by the current ATR and smoothed with an exponential moving average (controlled by the Smooth Len input) to prevent the band width itself from jumping erratically bar to bar.
• Trailing Trend Line Construction
The trend line follows classic chandelier-style trailing logic: while price remains above the trend line, the line can only ratchet upward (never retreating below its prior value even if the lower band momentarily dips beneath it); while price remains below the trend line, the line can only ratchet downward. A flip only occurs when confirmed prior-bar closing price crosses to the opposite side of the line.
• Six-Factor Regime Consensus Filter
Before a directional flip is permitted to display, up to six independent conditions are checked. If any active filter flags the market as "flat," the displayed direction holds at its previous confirmed state rather than flipping:
Stall Filter — flags when the trend line's bar-to-bar movement is smaller than a fraction (Flatness input) of current ATR, indicating the line itself has gone quiet.
Slope Filter — runs a short linear regression across recent trend-line values, measures the resulting slope, normalizes it against ATR, and flags when that normalized slope falls below the Slope Thr input.
Volume Filter — flags when confirmed volume falls at or below its own moving average, treating below-average participation as unreliable for a fresh directional call.
Range Filter — flags when the current bar's high-low range falls within the lower percentile band (Range Pct input) of its historical distribution over the Pctile Len lookback, identifying range compression.
BPS Filter — converts the trend line's bar-to-bar movement into basis points relative to price and flags when that figure falls under the Min BPS input, catching moves too small to be economically meaningful.
ADX Filter — computes a standard Directional Movement Index reading and flags when it sits below the ADX Thr input, indicating weak underlying trend strength.
• Breakout Override
Running in parallel to the consensus filters, this component measures the absolute prior-bar price change against a multiple of ATR (Ovr ATR Mult input). If that threshold is exceeded, the override forces the flip through immediately, bypassing every flat-market filter above. This prevents the filter layer from muting the system's response to genuine volatility expansion or breakout conditions.
🎨 Visual Guide
Trend Line — a stepped line plotted along the confirmed trailing band value. It renders in the Bull color when the confirmed direction is up and the Bear color when down; both colors are fully customizable in the Colors group.
Gradient Candles / Bar Coloring — when enabled, chart candles and bars are recolored on a gradient between the Neutral color and the active directional color, with gradient intensity scaled by how far confirmed price has extended from the trend line relative to ATR (capped at 3x ATR for full saturation). A muted candle indicates price sitting close to the trend line; a fully saturated candle indicates an extended move.
Cloud Fill — a semi-transparent fill (opacity set by Cloud Transp) rendered between the trend line and a short moving average of HLC3 (length set by Cloud MA Len), tinted in the active directional color to visually reinforce which side of the trend the market currently occupies.
Bull / Bear Signal Labels — a "Bull" label appears below price the bar a confirmed flip to the up-regime occurs, and a "Bear" label above price on a confirmed flip to the down-regime, provided the Regime Consensus Filter did not veto the flip and Lock Signal is not engaged.
Trade Level Lines and Labels (optional, enabled via Show Trade Levels) — on each new confirmed signal, five lines are drawn forward from the signal bar: an Entry line (at prior confirmed close), a Stop Loss line, and three Take Profit lines (TP1, TP2, TP3), each offset from entry by ATR multiples set in the Trade Tools group. A shaded risk zone connects Entry to Stop Loss, and a shaded reward zone connects Entry to the furthest take-profit line. Each line carries a right-aligned label showing its exact price.
Live Dashboard (optional, position configurable via Dash X / Dash Y) — a compact table summarizing current symbol/timeframe, signal lock state, active direction, current signal status, regime classification (Flat/Trending), breakout override status, active adaptive filter type, current trend-line and ATR values, a visual progress bar for trend strength, and individual on/off/flat status readouts for each of the six regime filters.
Non-Standard Chart Warning — a red-bordered table automatically appears in the top-left corner if the script detects it is being run on a Heikin Ashi, Renko, Line Break, Kagi, or Point & Figure chart, warning that signal reliability is compromised on synthetic chart types.
📖 How to Use
A "Bull" label with the trend line switching to the Bull color signals a confirmed transition to an up-regime that has passed all active consensus filters (or was pushed through by the breakout override).
A "Bear" label with the trend line switching to the Bear color signals the equivalent confirmed down-regime transition.
Because flips are gated by the consensus filter, the absence of a new signal during a period of price consolidation is intentional — the script is treating the move as noise rather than a lack of function. Check the dashboard's individual filter rows to see exactly which condition(s) are currently classifying the market as flat.
The dashboard's "Override" row shows "Engaged" when the Breakout Override has just bypassed the filters — useful for distinguishing a filter-confirmed signal from a volatility-forced one.
When Show Trade Levels is active, treat the Entry/SL/TP lines as a reference risk framework tied to current ATR, not a guaranteed execution plan; always verify levels make sense for the instrument and timeframe before acting on them.
Enable Lock Signal to freeze the current signal state on the most recent bar, useful when reviewing historical signal behavior without new signals interrupting the current view.
If the Non-Standard Chart warning appears, switch to a standard candlestick chart type before relying on any signal from this script.
⚙️ Inputs and Settings
ATR Len — lookback period for the underlying ATR calculation that drives band width and multiple filter thresholds. Shorter values make the band more reactive to recent volatility; longer values smooth it out.
Band Mult, ATR Weight, Move Weight — the three components that combine into the dynamic band multiplier. Band Mult sets a base width, ATR Weight scales the contribution of current ATR relative to price, and Move Weight scales the contribution of recent capped price movement.
Smooth Len — the EMA length applied to the calculated band half-width, controlling how quickly the band itself can widen or narrow.
Adaptive Filter / Filter Type — toggles and selects between Kalman and LLAMA smoothing of the source price feeding the trend line.
Kalman Q / Kalman R — process noise and measurement noise inputs for the Kalman filter; higher Q increases responsiveness, higher R increases smoothing.
LLAMA Len — lookback window for the efficiency-ratio calculation driving the LLAMA adaptive average.
Stall Filter / Flatness — enables the stall check and sets the ATR-relative threshold below which trend-line movement is considered stalled.
Slope Filter / Reg Len / Slope Thr — enables the regression-slope check, sets its lookback window, and sets the normalized slope threshold below which the market is considered flat.
Volume Filter / Vol MA Len — enables the volume check and sets the moving-average length volume is compared against.
Range Filter / Pctile Len / Range Pct — enables the range-compression check and sets the historical lookback and percentile threshold used to classify current range as compressed.
BPS Filter / Min BPS — enables the basis-point movement check and sets the minimum basis-point threshold for a trend-line move to be considered meaningful.
ADX Filter / ADX Len / ADX Thr — enables the ADX-based trend-strength check and sets its calculation length and minimum threshold.
Breakout Ovr / Ovr ATR Mult — enables the override and sets the ATR multiple of single-bar price change required to force a flip through the filters.
Show Trade Levels / SL, TP1, TP2, TP3 ATR Mult — enables the trade-level drawing tool and sets each level's distance from entry as a multiple of ATR.
Bar Coloring, Bull/Bear Marks, Cloud Fill, Cloud MA Len, Cloud Transp — visual toggles and parameters controlling gradient candles, signal labels, and the cloud fill between trend line and reference average.
Show Dash, Dash X, Dash Y — toggles the dashboard and sets its screen position.
Long/Short/Close Action inputs — customizable text strings inserted into the "action" field of each alert's JSON payload, for direct use with automated webhook execution systems.
Colors group — full color customization for bull/bear/neutral states, label text, warning banner, dashboard theme, gradient candle tiers, and trade-level line colors.
🔍 Deconstruction of the Underlying Scientific and Academic Framework
The trailing-band mechanism draws on the same volatility-normalized stop methodology popularized by Chandelier Exit-style systems, which themselves extend J. Welles Wilder's Average True Range concept into an adaptive trailing stop: rather than a fixed price distance, the stop distance breathes with recently realized volatility, tightening in calm markets and widening in turbulent ones.
The Kalman filter option applies a classical state-space estimation technique originally developed for aerospace tracking problems (Rudolf Kálmán, 1960). It treats the "true" price trend as an unobserved state to be estimated from noisy observations, recursively updating a prediction and its uncertainty at each time step and weighting new information by a gain term derived from the relative magnitude of prediction versus measurement uncertainty. Applied to price series, it produces a smoothed estimate that adapts its own responsiveness based on the ongoing balance of signal versus noise.
The LLAMA adaptive average is built on an efficiency-ratio concept in the lineage of Perry Kaufman's Adaptive Moving Average research: the ratio of net directional displacement to total path length over a window quantifies how "efficiently" price has trended, and this ratio is used to interpolate the smoothing constant between fast and slow exponential-average bounds. Markets that trend efficiently receive a fast, responsive average; markets that chop inefficiently receive a slow, heavily smoothed one.
The Slope Filter applies ordinary least squares (OLS) linear regression across a short trend-line window to extract a first-derivative estimate (slope) of the trend line's trajectory, normalizing it by ATR so the threshold behaves consistently across instruments and volatility regimes of different scale.
The ADX Filter is grounded in Wilder's Directional Movement System, which decomposes price movement into positive and negative directional components and derives a smoothed trend-strength oscillator independent of direction — a standard framework for distinguishing trending from ranging conditions.
The Range Filter's use of percentile-rank classification reflects a basic non-parametric statistical approach: rather than assuming a normal distribution of high-low ranges, it empirically ranks the current range against its own recent historical distribution, which is more robust to the fat-tailed, non-normal behavior typically observed in financial return and range series.
Collectively, the six-factor consensus mechanism reflects a general principle from ensemble/multi-condition filtering: requiring independent, structurally uncorrelated confirmations to agree (or, here, requiring none to actively veto) before acting on a signal tends to reduce the false-positive rate relative to any single condition acting alone, at the cost of some responsiveness — a classic precision/recall tradeoff which the Breakout Override is specifically designed to mitigate during high-volatility regimes.
⚠️ Disclaimer
All provided scripts and indicators are strictly for educational exploration and must not be interpreted as financial advice or a recommendation to execute trades. We expressly disclaim all liability for any financial losses or damages that may result, directly or indirectly, from the reliance on or application of these tools. Market participation carries inherent risk where past performance never guarantees future returns, leaving all investment decisions and due diligence solely at your own discretion. Индикатор

Индикатор

MQE - Market Quality Engine v1.6# MQE — Market Quality Engine v1.6
**MQE is not a buy/sell signal generator.** It is a Decision Support System that measures the quality of the current market environment on a standardized 0-100 scale. Its purpose is not to dictate "Buy" or "Sell," but to present, transparently and explainably, how favorable current market conditions are for opening a directional position.
## Methodology
MQE combines evidence from five independent analytical engines:
- **Trend Engine** — Evaluates market structure direction using EMA structure, AlphaTrend, and Comparative Relative Strength (CRS) against a benchmark (default BIST:XU100).
- **Flow Engine** — Measures directional capital commitment using a Cumulative Delta Volume (CDV) approximation; unlike raw volume, it prioritizes directional information over mere activity. The engine's highest-weighted criterion (40%) is whether CDV's fast average (EMA5) remains above its slow average (SMA68) — a strong, sustained CDV reading is interpreted as confirmation that the underlying scenario has not broken down.
- **Opportunity Conditions Engine** — Built around Relative ATR, this engine evaluates "tradability" rather than raw volatility; neither extreme compression nor extreme expansion is treated as inherently favorable.
- **Participation Engine** — Uses Relative Volume to assess whether sufficient market participation supports the current move; it is non-directional and primarily feeds into the Confidence output.
- **Momentum Engine** — MFI-based; deliberately avoids classic overbought/oversold interpretation and instead evaluates the persistence of directional energy as a supporting, confirmatory layer.
The output of these five engines is combined using regime-adaptive weighting — based on the current market **Regime** (Bull Trend / Bear Trend / Range / Transition) — into independent **Long Score** and **Short Score** values (0-100). Contradictions between engines are captured separately by a **Penalty** mechanism that only ever reduces the score, while the internal consistency of the evidence is reported through a fully independent **Confidence** value (0-100) that never alters the score itself. A high score paired with low confidence signals an environment that looks attractive but is backed by inconsistent evidence; high score with high confidence signals strong agreement across all evidence families.
For quick manual screening, MQE also provides a composite **Grade** (A+ through D), calculated separately for both directions.
## Dashboard
Two independent panels are provided: a **Primary Dashboard** (Long/Short Score, Confidence, Regime, and per-engine summaries — shown side-by-side for both the last closed bar and the live bar), and a **Diagnostics Panel** (per-engine breakdowns, penalty sources, raw indicator values, and active confirmation timeframes).
## Timeframe Adaptivity
Higher-timeframe confirmation and the AlphaTrend calculation automatically scale to the chart's timeframe (from 5-minute up to weekly), so no manual configuration is required by default; manual overrides remain available for advanced customization.
## Credit
The AlphaTrend calculation logic is adapted from the publicly known AlphaTrend concept originally developed by Kıvanç Özbilgiç.
## Disclaimer
MQE is not financial advice; it provides a statistical assessment of market conditions only. Past performance or evidence consistency does not guarantee future price behavior. All trading decisions and risk management remain the sole responsibility of the user.
Индикатор

ATR % (Volatility) [COCOSTA]English
ATR % (Volatility)
This indicator converts Average True Range (ATR) into a percentage of price, making volatility comparable across different assets and price levels — something raw ATR (an absolute value) can't do.
How it works:
ATR % = ATR(14) / Close × 100, plotted in a separate pane below the chart
A shaded range channel shows the highest and lowest ATR % values over the past 262 bars, excluding the current bar
When the current ATR % breaks above or below that 262-bar range, the line changes color (red = upside breakout, orange = downside breakout) and the background highlights, so unusual volatility expansions/contractions stand out at a glance
Settings:
ATR Length (default 14) — the standard Wilder ATR period
Range Lookback (default 262, ≈1 trading year on the daily chart) — the historical window used to build the high/low channel, fully adjustable
This tool is designed to help identify when volatility is moving outside its recent historical norm, which can be useful for spotting potential breakouts, squeezes, or regime changes. It is not a standalone buy/sell signal — use it alongside your own analysis and risk management.
日本語
ATR % (Volatility)
このインジケーターは、ATR(Average True Range)を価格に対する%に変換したものです。ATRは絶対値のため銘柄や価格水準が違うと単純比較ができませんが、%化することで異なる銘柄・時間軸間でもボラティリティを横並びで比較できます。
仕組み:
ATR% = ATR(14) ÷ 終値 × 100 を計算し、チャート下のサブ画面に表示
当日を含まない過去262本分のATR%の最高値・最低値でできるレンジをチャネル(帯)として塗りつぶし表示
当日のATR%がこの過去262本のレンジを上抜け・下抜けすると、ラインの色が変化(赤=上方ブレイク、オレンジ=下方ブレイク)し、背景にもハイライトが入るため、通常のレンジから外れたボラティリティの拡大・縮小が一目でわかります
設定項目:
ATR Length(初期値14)— 標準的なワイルダー式ATR期間
Range Lookback(初期値262、日足で約1年間に相当)— レンジ算出に使う過去期間。自由に変更可能
このツールは、ボラティリティが直近の通常レンジから外れたタイミングを把握する補助として設計されています。ブレイクアウトやスクイーズ、相場のレジーム変化の兆候を捉える際にご活用ください。単独の売買シグナルではないため、ご自身の分析・リスク管理と併せてご利用ください。 Индикатор

Market Acceleration Model• MARKET ACCELERATION MODEL
The Market Acceleration Model (MAM) is designed to identify changes in the rate at which price is moving through the market.
Rather than measuring momentum candle-by-candle, MAM samples price across a defined number of candles, calculates a structural average, and compares the displacement between consecutive structural samples.
The objective is simple:
Is price movement accelerating upward, accelerating downward, or losing acceleration?
• WHAT DOES "ACCELERATION" MEAN?
MAM measures the change in structural displacement .
When consecutive structural samples begin separating by increasingly larger distances, the market is displaying expanding movement.
• Green = Upward Acceleration
Price is moving upward and the magnitude of that structural movement is increasing.
• Red = Downward Acceleration
Price is moving downward and the magnitude of that structural movement is increasing.
• Neutral = No Significant Acceleration
The change in structural displacement is not large enough to exceed the selected acceleration threshold.
This makes MAM different from a traditional momentum oscillator. It is not primarily asking whether price is moving up or down. It is asking whether the rate of structural price expansion is increasing or decreasing .
• HOW THE MODEL WORKS
MAM divides the chart into structural sampling intervals using the Loopback setting.
For example, with Loopback = 20:
• The first 20 candles are sampled.
• A structural average is calculated.
• The next 20 candles are sampled.
• A new structural average is calculated.
• The displacement between those structural averages is measured.
• That displacement is compared with the previous structural displacement.
The process then repeats across the chart.
This creates a structural sequence rather than reacting to every individual candle.
• CALIBRATING LOOPBACK
The most important setting is Loopback .
Loopback determines how many candles are grouped together before MAM creates a structural observation.
Lower Loopback = More Responsive
Lower values allow the model to react to shorter-term changes in price movement.
This is generally more appropriate for:
• Lower timeframes
• Intraday trading
• Short-term market structure
• Faster acceleration/deceleration changes
The tradeoff is increased sensitivity to market noise.
Higher Loopback = More Structural
Higher values require price movement to persist across a larger number of candles before the model recognizes a structural change.
This is generally more appropriate for:
• Higher timeframes
• Larger market swings
• Broader trend analysis
• Filtering short-term fluctuations
The tradeoff is that acceleration transitions will be recognized later.
• LTF vs MTF vs HTF CALIBRATION
There is no universal "correct" Loopback value.
The appropriate setting depends on the relationship between your chart timeframe and the structural movement you are attempting to measure .
For LTF analysis, use a relatively smaller Loopback if you want MAM to respond to internal market movement.
For MTF analysis, increase the Loopback so the model represents a larger intermediate structure rather than individual candle fluctuations.
For HTF analysis, larger aggregation intervals are generally preferable when the goal is to identify major expansion and contraction in the market.
A useful way to think about calibration is:
LTF → Internal Movement
MTF → Intermediate Structure
HTF → External / Major Structure
The exact values should be calibrated to the instrument and trading style rather than treated as universal defaults.
• TIMEFRAME-SPECIFIC CALIBRATION
When moving between timeframes, remember that Loopback is measured in candles, not minutes or hours .
For example, Loopback = 20 means:
• 20 candles on a 1-minute chart = approximately 20 minutes
• 20 candles on a 5-minute chart = approximately 100 minutes
• 20 candles on a 1-hour chart = approximately 20 hours
• 20 candles on a 4-hour chart = approximately 80 hours
Therefore, the same Loopback setting can represent dramatically different structural horizons depending on the chart timeframe.
If you change timeframe, reassess Loopback rather than assuming the same value will produce the same market structure.
• AVERAGE METHOD
The Average Method determines which price representation is used when calculating each structural sample.
Available methods:
• Close
• HL2
• HLC3
• OHLC4
Close places the greatest emphasis on where the market finished each candle.
HL2 uses the midpoint of the candle's high and low and provides a more range-oriented representation.
HLC3 incorporates the high, low, and close.
OHLC4 incorporates the complete OHLC structure.
For a cleaner structural representation, HL2 or HLC3 can be useful. For a close-oriented interpretation, Close may be preferable.
• ACCELERATION THRESHOLD
The Acceleration Threshold % controls how much the structural displacement must change before MAM recognizes meaningful acceleration.
Lower threshold :
• More signals
• More sensitivity
• Earlier recognition
• Greater exposure to noise
Higher threshold :
• Fewer signals
• Stronger confirmation
• Less sensitivity to minor changes
• Greater emphasis on meaningful expansion
If MAM appears too reactive, increase the threshold.
If MAM appears too slow or is ignoring useful acceleration phases, decrease the threshold.
• HOW TO THINK ABOUT THE COLORS
The colors should be interpreted as direction + acceleration , not simply bullish/bearish trend signals.
Green means upward price displacement is expanding.
Red means downward price displacement is expanding.
A market can therefore be moving upward while not displaying green acceleration if its upward displacement is contracting.
Likewise, a market can remain below a prior structural level while no longer displaying red acceleration if downward displacement is losing momentum.
This distinction is important.
MAM is designed to identify changes in the intensity of movement, not simply market direction.
• PRACTICAL CALIBRATION APPROACH
Rather than searching for a "perfect" setting, calibrate MAM according to the market behavior you want to observe.
Start with:
1. Choose the structural horizon.
Decide whether you want to measure internal LTF movement, intermediate MTF movement, or larger HTF movement.
2. Adjust Loopback.
Increase Loopback until the structural path represents the type of movement you actually care about.
3. Adjust the Acceleration Threshold.
Increase the threshold if there are too many insignificant color changes.
Decrease it if meaningful acceleration is being filtered out.
4. Test different Average Methods.
Compare Close, HL2, HLC3, and OHLC4 to determine which price representation best reflects the structure you are attempting to measure.
5. Calibrate per instrument.
Different markets have different volatility characteristics. A setting that works well on one instrument may be too sensitive or too slow on another.
• THE BIGGER IDEA
Think of MAM as a way of observing how the market is changing its rate of movement .
Consolidation can produce relatively small structural displacement.
Expansion produces larger structural displacement.
When expansion itself begins increasing, the market is accelerating .
When expansion begins weakening, the market is decelerating .
This makes the model useful as a contextual tool for studying:
• Expansion vs. contraction
• Trend development
• Momentum transitions
• Structural movement
• Breakout behavior
• Increasing or decreasing directional pressure
MAM IS NOT INTENDED TO BE A STANDALONE BUY/SELL SYSTEM.
It is best used as a market-condition and movement-intensity model , providing structural context that can be combined with price action, market structure, liquidity, supply/demand, or other forms of analysis.
• DISCLAIMER
MAM is an analytical tool and should not be interpreted as a guarantee of future price movement. No setting is universally optimal. Always calibrate the model to the instrument, timeframe, volatility environment, and type of market structure you are attempting to analyze.
Индикатор

Rolling VWAP with SignalsRolling VWAP with Signals
Overview
Rolling VWAP with Signals plots a time-window ("rolling") VWAP with standard deviation bands, and generates filtered buy/sell signals on band breakouts. Unlike a session VWAP, which resets at a fixed anchor such as the start of day or week, this VWAP recalculates continuously over a trailing window that you define, for example the last 10 hours or the last 2 minutes of 3-minute bars. This keeps it adapting on any chart, in any session, in any market, including markets that trade around the clock.
This script is an original extension built on the rolling VWAP concept from Rolling VWAP . It adds standard deviation bands, trend-state coloring, crossover based buy/sell signals, an ATR rising filter, and a VWAP trend-alignment filter, none of which are present in the original.
How It Works
The rolling VWAP is computed by summing price times volume and volume over a trailing time window, then dividing, the standard VWAP formula applied to a moving window instead of a fixed session. The calculation runs on an independent timeframe set by the RVWAP Timeframe input, evaluated with request.security().
Standard deviation bands sit above and below the VWAP at a configurable multiple of the rolling standard deviation, computed with the direct weighted squared deviation method rather than the E minus E ^2 shortcut, which avoids precision loss on high-priced instruments.
smoothedATR = ta.swma(ta.atr(atrLength))
atrRising = not useATRFilter or smoothedATR > smoothedATR
Trend state is bullish when the VWAP is higher than it was one higher-timeframe bar ago and price is above the upper band, and bearish under the mirrored condition. The VWAP line is colored accordingly.
Buy and sell signals fire once, on the bar where price crosses a band, not on every bar price remains outside it:
Buy — close crosses over the upper band
Sell — close crosses under the lower band
Two optional filters narrow signals to higher-conviction setups:
Rising ATR — requires an SWMA-smoothed ATR to be higher than the prior bar, filtering out breakouts occurring while volatility is contracting
RVWAP trend alignment — requires the bullish or bearish trend state described above, so buy only fires in an established uptrend and sell only in an established downtrend
Four alert conditions are available: price above the upper band, price below the lower band, a buy signal, and a sell signal.
Inputs
RVWAP Timeframe — Timeframe the rolling VWAP and standard deviation calculation runs on, independent of the chart timeframe. Default: 1 minute.
RVWAP Time Period (Hours / Minutes) — Length of the trailing window used for the rolling calculation. Shorter windows track faster; longer windows behave more like a session VWAP. Default: 0 hours, 1 minute.
Standard Deviation Multiplier — Distance of the bands from the VWAP, in standard deviations. Lower values give tighter bands and more signals; higher values give wider bands and fewer, stronger signals. Default: 1.618.
Show Standard Deviation Bands — Toggles the band plots and disables buy/sell signals when off, since signals require a band cross. Default: on.
Show Fill Between Bands — Toggles the shaded fill between the upper and lower bands. Default: on.
Smooth VWAP/StdDev — Applies additional smoothing to the VWAP and standard deviation lines for a less-lagged appearance when off, or a smoother, laggier line when on. Default: off.
Require Rising ATR for Signals — Gates buy and sell signals on a rising smoothed ATR. Default: on.
Length — ATR length used by the rising-ATR filter. Default: 14.
Require RVWAP Trend Alignment for Signals — Gates buy signals on a bullish RVWAP trend and sell signals on a bearish RVWAP trend. Default: on.
Upper Band, Lower Band, Fill — Colors for the band lines and the fill between them.
Usage Notes
Requires a data feed that provides volume; the script raises a runtime error if none is available.
The rolling calculation needs a minimum of 10 bars within the window to produce a value; very short windows on sparse data may show gaps.
Rising ATR means the current SWMA-smoothed ATR value is strictly greater than the previous bar's value, a one-bar comparison rather than a multi-bar slope.
Values inside the current, still-forming RVWAP Timeframe bar can update intrabar, as with any request.security() call without a fixed historical offset. Confirmed bars do not repaint.
Disable both signal filters to see every raw band-crossing signal, or enable them independently to trade off signal frequency against signal quality.
Credits
Rolling VWAP methodology adapted from the original Rolling VWAP .
Uses the open-source PineCoders ConditionalAverages library for the windowed total calculations.
Disclaimer
This script is provided for educational and informational purposes only and does not constitute financial advice. Past performance is not indicative of future results. Always do your own research and apply proper risk management before trading.
Индикатор

Tyson Uppercut Compression Spring Breakout (Viprasol)Tyson Uppercut — Compression Spring Breakout 🥊
(The name is an affectionate combat-sports homage — this is an educational pattern tool, not affiliated with or endorsed by any athlete or organization.)
CONCEPT
A spring loaded by VOLATILITY, not by swings. The tool measures the recent bar-range and requires it to be compressed — noticeably tighter than the window before it (energy coiling). Then the uppercut: one wide-range bar that bursts up out of the compression on the close = the release. Distinct from swing-decay coils; this reads raw range contraction directly from the bars.
HOW IT DETECTS
- Compression is measured on CLOSED bars only: the highest high and lowest low over a window (default 10 bars, offset by one bar).
- That compression range must be tight versus the prior, wider window (default: <= 60% of the range over twice the lookback) AND not larger than a set ATR cap.
- Release: the current bar closes above the compression high, its full bar range is at least a set ATR multiple (default 1.3x ATR), and it closes up (close > open).
- All logic runs on bar close (barstate.isconfirmed). An optional dotted live box previews an active compression before any break.
ENTRY / STOP / TARGET
- Entry: on the confirmed release close (long only).
- Stop: below the compression low, minus an ATR buffer.
- Target: entry + R multiple of risk (default 2R, adjustable).
- Drawn as a solid compression box plus an entry line and filled TP/SL zones that extend right until price touches one; the hit side thickens.
NON-REPAINTING
Compression is read from already-closed bars (a one-bar offset is used), and the release is confirmed on the bar close. A printed signal does not move or disappear afterward. The live dotted preview is informational only and is not a signal.
KEY FEATURES
- Volatility-compression detection from raw range, with an ATR height cap to avoid oversized "boxes".
- Release requires a genuinely wide breakout bar, not just a marginal close.
- Optional live compression preview; option to hide new setups while a trade is active.
- Filled, extend-until-hit TP/SL zones and an on-chart status table (open trades). Alert condition included.
INPUTS OVERVIEW
- The spring: compression window (bars), tightness fraction vs prior window, max compression height (x ATR), release bar range (x ATR), ATR length.
- The knockout: TP as R multiple, SL buffer (x ATR), minimum bars between signals, one-trade-at-a-time, hide-setup-while-in-trade.
- Visuals: compression box / entry / TP / SL colors, label offset, zone transparency, show-live toggle.
HOW TO USE
1. Add to a liquid symbol and timeframe; it is fully overlay-based.
2. Set the compression window and tightness fraction to define how coiled the range must be.
3. Raise the release ATR multiple to demand a stronger breakout bar.
4. Watch the live dotted box to anticipate setups, and study the TP/SL zones on your instrument.
5. Optionally create an alert from the built-in condition.
LIMITATIONS (read this)
- This is a pattern/education tool, not a signal service and not financial advice. It does not predict the future.
- Compression breakouts frequently fail or reverse (false breakouts are common), especially in ranging markets.
- It is long-only by design; it does not trade downside releases.
- Range readings depend on the chosen windows; different settings can materially change what counts as "compressed".
- Results depend heavily on your inputs, instrument, and timeframe. Always use your own risk management and discretion.
CREDITS
ATR uses Wilder's Average True Range. Highest/lowest range measurement uses standard public functions (ta.highest / ta.lowest). The raw-range compression-and-release detection and the trade-zone visualization are original Viprasol design.
Original Viprasol work; no third-party Pine code reused.
Индикатор

Ronaldo Bicycle Kick Orbit Break Reversal [ Viprasol ]Ronaldo Bicycle Kick — Orbit Break Reversal (Viprasol)
WHAT IT DOES (the idea)
Most reversal tools watch a single line. This one watches a region. It treats recent price structure as a set of confirmed swing points that "orbit" a structural centre of mass, and it trades the moment price escapes that orbit to the upside. Like a ball coiling around a centre and then leaving orbit — that break is the signal. The name is a sporting homage to a spectacular finish; the tool itself is pure geometry.
HOW IT DETECTS
1. Swings: a lightweight zigzag keeps the last several confirmed pivots. A pivot is only accepted after the required number of bars close to its right, so swings do not move once printed.
2. Orbit geometry: from the last K swings (default 6) it computes the geometric centroid — the mean bar position and mean price. It then measures the average (root-mean-square) distance those swings sit from the centroid price. That distance, scaled by "Orbit radius," becomes the orbit ring. A minimum radius floor (in ATR) filters out flat, meaningless rings.
3. Escape: the setup arms only when the orbit is valid. The signal fires on the first bar that CLOSES above the top of the orbit ring (centroid price + radius) having closed at or below it on the prior bar.
ENTRY / STOP / TARGET
- Entry: the close of the escape bar (long only).
- Stop: the lowest swing price inside the orbit, minus an ATR buffer.
- Target: Entry + R multiple x risk (default 2R), where risk = Entry - Stop.
Each trade draws an entry line plus filled TP and SL zones that extend forward bar by bar until price touches one of them, then freeze.
NON-REPAINTING
Signals are built from confirmed pivots and only evaluated on a confirmed (closed) bar. Nothing is placed on the developing bar, so a printed signal does not disappear or shift on later ticks. The dotted "live orbit" preview is a forward-looking sketch of the current geometry and is not a signal.
KEY FEATURES
- A real orbit ellipse is drawn around the centroid so you can see the ring being broken.
- Extend-until-hit TP/SL zones with a one-trade-at-a-time option.
- Optional hide-new-setup-while-in-trade to reduce clutter.
- Adjustable pivot width, swing count, orbit radius, ATR floor, R multiple, stop buffer, and a minimum-bars-between-signals gap.
INPUTS OVERVIEW
Swing pivot left/right bars; swings used for the orbit; minimum swings for validity; orbit radius multiplier; minimum orbit radius in ATR; ATR length; TP R multiple; SL ATR buffer; signal gap; one-trade toggle; visual colours and label offset.
HOW TO USE
1. Add to any liquid symbol and timeframe; it works on all.
2. Watch for the dotted orbit ring to form around recent structure.
3. Take note when a bar closes above the ring and the GOAL label prints.
4. Use the drawn entry, TP, and SL zones as a visual trade map; adjust the R multiple and stop buffer to your own plan.
5. Raise the pivot width or ATR floor on noisy, low-timeframe charts to demand cleaner structure.
LIMITATIONS (honest)
- This is a pattern and education tool, not a signal service or an autotrading system. It highlights a geometric condition; it does not predict outcomes.
- Long-only by design. It will not flag downside setups.
- In strong one-way trends the orbit ring can be escaped repeatedly; in choppy ranges valid orbits may be sparse. Context and discretion still matter.
- Requiring confirmed pivots means the orbit is defined slightly after a swing forms, which is the cost of non-repainting behaviour.
- Past behaviour of any pattern does not guarantee future results.
CREDITS
Built on public, well-known concepts: Average True Range (J. Welles Wilder) for volatility scaling, and standard pivot/zigzag swing detection. The orbit-centroid geometry and the escape logic are original Viprasol work. The "Bicycle Kick" name is an affectionate sporting homage and does not imply any endorsement or affiliation.
This script is an educational tool and is not financial advice. Trade your own plan and manage risk.
Original Viprasol work; no third-party Pine code reused.
Индикатор

Liquidity Sweep Tracker | Smart Money Stop HuntsThis strategy identifies where retail stop-losses and breakout orders cluster (swing highs/lows), waits for price to sweep through that liquidity, and enters only after a confirmed rejection back inside the range. No repainting on the wick, no chasing breakouts — just structured, confirmation-based reversal trading built around genuine Smart Money Concepts (SMC) mechanics.
Core Features
Sweep Detection Engine
Tracks swing highs/lows as live liquidity pools, scored by touch count
ATR-scaled sweep buffer filters out noise — only meaningful stop-runs qualify
Configurable confirmation window (N bars) for the rejection close back inside range
7-Factor Confidence Score (0–100)
Every signal is graded on sweep depth, touch count, market structure alignment, ATR volatility regime, post-sweep displacement, volume spike magnitude, and HTF zone proximity — giving you a single, transparent quality metric per trade instead of a black-box signal.
Structure-First Exits
Adaptive stop placement anchored to the actual sweep wick + volatility regime (not a flat ATR multiple)
Targets pull from real market structure: nearest Fair Value Gap (TP1) and opposing liquidity pool (TP2)
Automatic exit on opposing Break of Structure — if the thesis is invalidated, you're out
Optional time-based exit for setups that stall
Fully Modular Filters — Everything Toggleable
Volume spike confirmation
HTF liquidity zone alignment
Engulfing / displacement / break-of-sweep-candle confirmation triggers
Minimum reward-to-risk gate before any entry fires
All filters default OFF or loosely set — tune restrictiveness to your own edge
Clean, Purpose-Built Visuals
Thin liquidity lines at unswept swing levels — opacity/thickness scale with touch count, so "thicker" lines mark heavier resting liquidity
Simple BUY/SELL labels only on confirmed signals (confidence % included, no chart clutter)
Confidence-scaled glow on active stop/target lines
Win-rate table auto-bucketed by confidence tier (Low/Med/High) — see if your high-confidence signals actually outperform
Ideal Usage
Best markets: liquid index futures (ES/NQ), high-volume large-cap equities, major crypto pairs (BTC/ETH), and major FX pairs during session opens — anywhere real stop-hunting order flow exists
Best timeframes: 15m–1H for intraday/swing entries paired with a 4H–Daily HTF filter; scale the ratio proportionally for scalping or position trading
Best conditions: ranging-to-trending transitions around obvious structure (prior session highs/lows, equal highs/lows) — avoid dead, illiquid instruments where "sweeps" are just noise
Recommended workflow: start with filters off to see raw signal frequency, then layer in volume/HTF/R:R gates while watching the win-rate table to find your own confidence threshold sweet spot
Notes
Pivot-based swing/structure detection carries an inherent confirmation lag (no repainting, but structure is confirmed slightly after the fact). This is a strategy script — backtest thoroughly across your target instrument and timeframe before any live use, and treat the confidence score as a filter to calibrate, not a guarantee. Стратегия