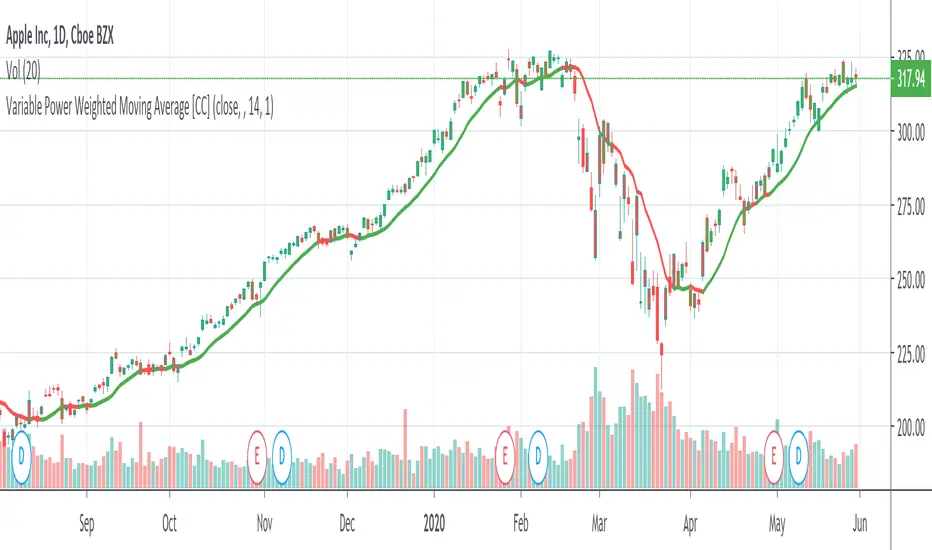
Индикатор
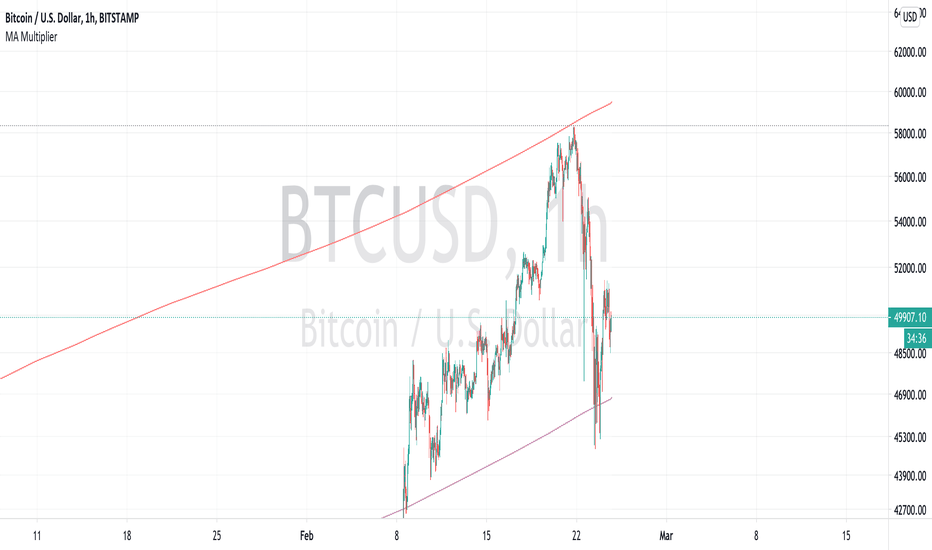
MA, MATR, ChEx | All in One - 4CR CUPIn trade position setup, we always need to determine the market structure and manage the position sizing in a short period of decision time. Indicators such as moving average, initial stop loss and trailing stop loss are always helpful.
This indicator put all these handy tools into a single toolkit, which includes the following price action and risk management indicators:
MA - Moving Average
MATR - Moving Average less Average True Range
ChEx - Chandelier Exit
This script further enhances the setting so that you can easily customize the indicators.
For both the Moving Averages and the Moving Average less Average True Range , you can pick a type of moving average which suits your analysis style from a list of commonly used moving average formulations: namely, EMA , HMA , RMA, SMA and WMA , where EMA is selected as default.
The Moving Average less Average True Range , MATR, is usually applied as a reference to set the initial stop loss whenever opening a new position.
The abbreviation, MATR, is picked, so that this can serve as a handy reminder of a very good trading framework as elaborates as below:
M – Market Structure
A – Area of Value
T – Trigger
R – Risk Management (aka. Exit Strategy) Индикатор

Стратегия

MavilimW Strategy MTF EMA with HA CandlesThis is a strategy adapted initially for Mavilim moving average indicator, based on WMA MA.
It seems to works amazingly on long term markets, like stocks, some futures, some comodities and so on.
In this strategy, I form initially the candle, using EMA values, so I take the EMA of last 50 closes, open, highs and lows and form the candle
After this I take interally HA and convert the EMA candle to HA.
Then using the moving averages on multiple timeframes, like in this example we have a chart on 4h, but I use 1h and 1d moving averages.
For long condition we have : close is above moving average timeframe1 and oving average timeframe2 and oving average timeframe3
Initially short would be close below ma timeframe1, ma timeframe2 and timeframe3 -> but here I also convert it into a long signal.
So we actually go only long .
And we have 2 different exits : for first long if we have a crossdown of 1h ma with 1 day ma, and for second long if we have a cross up of 1h ma with 1 day ma in this example.
Message me if you have any questions about this strategy.
Стратегия

Индикатор
Индикатор

Индикатор

Индикатор
Индикатор
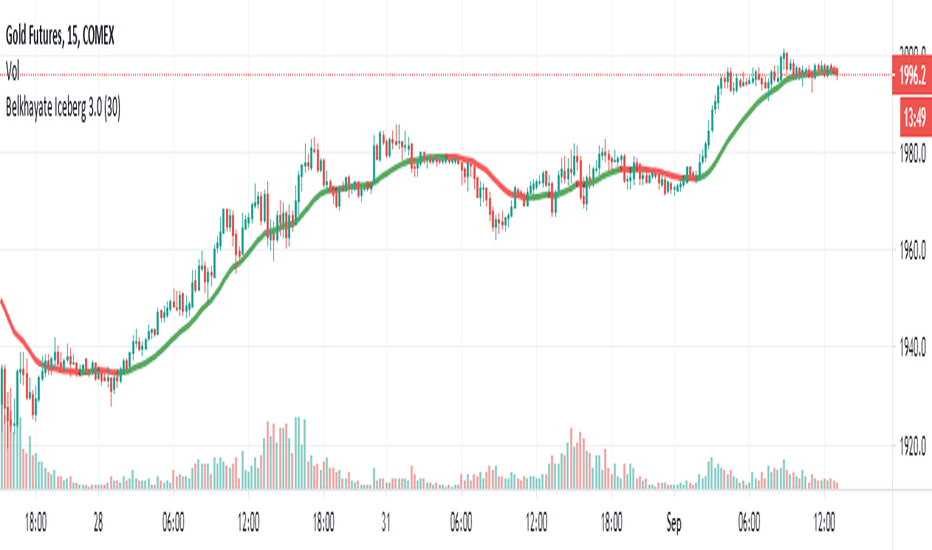
EMA_VTX
Abbreviations:
EMA - Exponential Moving Average
SMA - Simple Moving Average
WMA - Weighted Moving Average
VWMA - Volume-Weighted Moving Average
TP - TimePeriod (1m,2m,5m,1h....)
TP Steps - 1m,3m,12m,1h,5h,D (This steps i use)
Use-case:
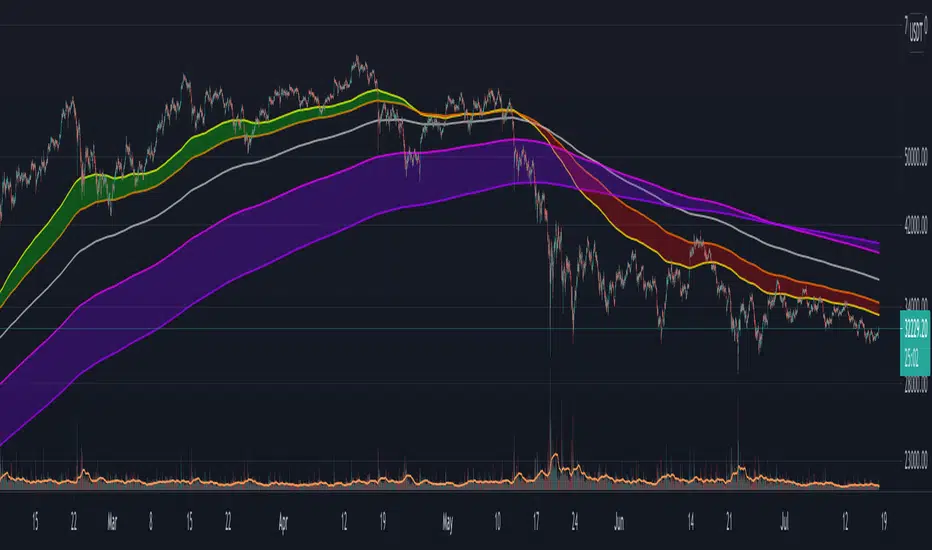
Moving Average Exponential is a good indicator of Support and Resistance Level. Giving us average price level in particular moment.
This script calculates and plots Moving Average with minute precision, even if you want to see 21 EMA level from 1H chart.
So you can accommodate all important information on one chart with best precision.
Made for Intraday Perioads.
Best used for DayTrading, when you need to make quick and efficient decisions.
EMA_VTX = Preferred resolution * Length / Present resolution.
In addition to plotting EMA , you can quickly switch between SMA, WMA, VWMA .
Settings:
Resolution - Most used TP included, plus some exclusive paid plans (1m, 2m, 3m, 5m, 12m, 15m, 1h, 4h, 5h, Daily). Default set to 1h
Use - Bonus function for EMA indicator. You can quickly switch type from EMA to SMA, WMA,VWMA
Length - standard function. Default set to 144
Offset - standard function. Default set to 0
Source - standard function. Default set to hlc3
Why to use it ?
Yes, i know that variable TP is standard now in TradingView. But there are some limitations, especially for DayTraders.
Problem:
Imagine you are trading/scalping on 1m.. 5m.. 15.. charts and you want to see where are your Higher TP MAs.
-- You can change to 1h and check it, but you will loose the picture from smaller TP.
-- You can use Standard EMA TP function, but your MAs data will update every 15m, 1h (depends on TP)
Solution:
This script help to solve this problem, by breaking information down to 1m and building from there.
So whatever Intraday TP you choose to trade, your MAs will be updated with minute precision.
Limitations:
Sadly nothing without limitations.
1. You can experience "Reference too many candles in history" around 5K - This means that too many candles are used to plot MAs.
-- Quick fix: Reduce "Length" or Step down TP (best experience when projecting MAs 1-2 TP Steps up)
2. For Best performance use only Higher TP dividable By Yours (ex. You use 3m chart, then you can plot 12m, 15m, 1h / You use 5m chart, then you can plot 15m, 1h. 12m will already have 3m of information lost using 5m Chart ) Индикатор

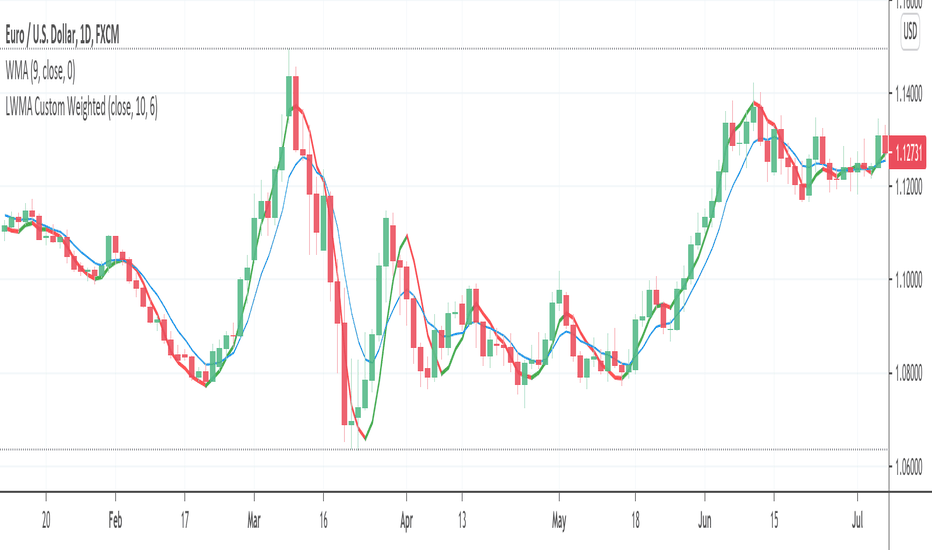
LWMA: Linear Weighted Moving AverageCouldn't find searching for Linearly Weighted Moving Average (LWMA) in tradingview. Found one with the LWMA title, but it uses plain WMA calculation without the linearity which more heavily weights recent price data, which I need, so I try to made one.
LWMAs are also quicker to react to price changes than SMA and EMA. If you want a moving average with less lag than an SMA, try a LWMA.
It kind of also have a more clarity in defining the price trend and reversals. Trade signals usually based on crossovers, they can also indicate areas of potential support or resistance. But beware though, multiple false signals may also occur before a significant trend develops. Use a filter, some decent volatility oscillator might do the job.
--
The formula for this Linearly Weighted Moving Average is:
LWMA = (( P n∗ W 1)+( P n−1∗ W 2)+( P n−2∗ W 3)...) / ∑W
P = Price for the period
n = The most recent period, n-1 is the prior period, and n-2 is two periods prior
W = The assigned weight to each period, with the highest weight going first and then descending linearly based on the number of periods being used.
I hope I'm doing right translating it to Pine Script 4. Let me know if I miss something.
Индикатор
Индикатор

Индикатор

Индикатор

Индикатор

Индикатор
Индикатор

Индикатор

Индикатор

WMA/LSMA - Simplified CalculationsLots of moving averages are based on a weighted sum, the most common ones being the simple (arithmetic) and linearly weighted moving average. The problems with the weighted sum approach is that when your moving average is a FIR filter then the number of operations increase with higher values of length, and when the weights are based on a complex calculation this number of operations can increase drastically!
For the common technical analyst the calculation time of moving averages can be an insignificant factor, even more when using higher time frames, however its always a good practice to seek better performances. The SMA has already a calculation where the number of operations is independent of its length, as such it can be easy to do the same for the linearly weighted moving average (WMA). This post will describe the process toward calculating a simple and efficient WMA which will then be used to provide an efficient calculation of the least squares moving average (LSMA).
Carving Impulses Responses
Remember that impulses responses fully describe the properties of moving averages, the impulse response of the WMA is a linearly decreasing function, so we'll try to calculate it without using a weighted sum. We first need to use a cumulative sum, the cumulative sum can be described as a summation from the first element of a series to the n th element of the series, where n is the current bar number, one could say that this operation is actually super inefficient, however this is not the case, as a cumulative sum can be calculated recursively as follows:
y = y + x
The cumulative sum can be described as an amplifier and posses the following impulse response:
Once the cumulative sum receive the impulse signal as input the result will always be equal to 1. This will form the basis of our simplified calculation, all we need to do transform this response into a linearly decreasing one. The full process is as follows:
Get the impulse response of the cumulative sum
Subtract this response from a linearly increasing impulse response of size length
Normalize the result such that the sum of the resulting response is equal to 1
We need a linearly increasing response of size length , this can be done by using a running sum of the original cumulative sum response, however we must make sure that the value of this response is 0 when the one of the cumulative sum is first equal to 1. Because the resulting response as a maximum value of length we need to multiply our cumulative sum response with length , then we proceed to subtraction.
Finally we need to normalize the result, the sum of a linear sequence of values starting at 1 and ending at n is given by the explicit formula : n(n+1)/2 , which in our case give length*(length+1)/2 , we divide our previous response with this result and we end up with the impulse response of a WMA. This process can be graphically described as follows:
We can then replace the impulse function by the closing price in order to get the WMA of the closing price.
Advantages And Disadvantages
The big advantage of this calculation is its efficiency, in its non functional form (you can see it in the code) the calculation of the WMA only require 9 operations regardless of the value of length against length*2 + 4 for the weighted sum approach, as such both methods are equally efficient in terms of operations as long as the length of a standard WMA is inferior to 3, which is ridiculous, as such our approach is more appropriate.
Another advantage is that Pinescript does not allow for series as length arguments in the WMA function, however here we can have a variable length for the WMA.
Of course there are disadvantages to this approach, in terms of code we require more variables for the non functional form, which create a lengthier scripts. Another disadvantage is that we can be prone to rounding errors due to the cumulative sum, however they shouldn't be significants in our case.
Getting The Least Squares Moving Average
The LSMA is one of my favorite moving averages, and it can derived from a linear combination between the WMA and SMA described as follows : 3WMA - 2SMA. Since we proposed an alternative calculation of the WMA we can then calculate the LSMA without even using the SMA, why ? because the SMA can be calculated by computing the changes over length period of the cumulative sum of an input, this result is then divided by length .
Remember that the impulse response of a cumulative sum is just a rectangular function, all we need is to truncate it such that only length values of the response are equal to 1, this is done thanks to the change function in Pine.
In Summary
A more efficient calculations for both the WMA and LSMA have been presented, while this on itself isn't super important you have learned what is the process toward calculating a filter without relying on a weighted sum.
This calculation will soon be included in the Pinecoders script allowing series as length argument.
Thank you for reading, your interest is always appreciated !
Индикатор

Индикатор

Индикатор

Индикатор