Это пространство с платным контентом EdgeTools. Теперь вы можете получить доступ к индикаторам пользователя напрямую на TradingView. Читайте подробнее о платном контенте Aggregate Bull & Bear Index Aggregate Bull and Bear Index
The Aggregate Bull and Bear Index represents a systematic approach to measuring market sentiment through the aggregation of multiple fundamental market factors. This indicator draws conceptual inspiration from the Bank of America Bull and Bear Indicator, a widely followed institutional sentiment gauge that has demonstrated significant predictive value for market turning points over multiple market cycles (Hartnett, 2019). While the original Bank of America indicator relies on proprietary institutional data flows and internal metrics that remain inaccessible to individual investors, the Aggregate Bull and Bear Index provides a methodologically similar framework using publicly available market data, thereby democratizing access to sentiment analysis previously reserved for institutional participants.
The theoretical foundation of sentiment based investing rests on decades of behavioral finance research demonstrating that market participants systematically exhibit predictable psychological biases during periods of extreme optimism and pessimism. Shiller (2000) documented how irrational exuberance manifests in asset prices through feedback loops of investor enthusiasm, while Kahneman and Tversky (1979) established that human decision making under uncertainty deviates substantially from rational expectations. These behavioral patterns create opportunities for contrarian strategies that exploit the tendency of crowds to overreact at market extremes. The Aggregate Bull and Bear Index quantifies these psychological states by synthesizing information from diverse market segments into a unified scale ranging from zero to ten, where readings below two indicate extreme fear and readings above eight signal extreme greed.
Methodology and Calculation Framework
The methodology underlying the Aggregate Bull and Bear Index incorporates statistical normalization techniques that transform raw market data into comparable standardized scores. Each component factor is processed through a calculation that measures how far current values deviate from historical norms, effectively capturing whether specific market metrics exhibit unusual readings relative to their own history. These normalized components are then aggregated using a weighting scheme designed to balance information from different market segments while minimizing noise and false signals. The final composite undergoes percentile ranking over a trailing lookback period to produce the familiar zero to ten scale that facilitates intuitive interpretation.
The indicator incorporates several important features designed to enhance signal quality and reduce the probability of acting on spurious readings. A consensus filter examines whether multiple underlying components align in the same direction, adding weight to signals when broad agreement exists across different market factors and discounting readings that rest on narrow evidence. Dynamic threshold adjustment allows the extreme zones to adapt to changing market volatility regimes, recognizing that the appropriate definition of extreme varies depending on ambient market conditions. These refinements reflect lessons learned from decades of quantitative finance research on signal processing and regime detection.
Professional Application and Portfolio Integration
Professional portfolio managers have long recognized the value of sentiment indicators as a complementary tool to fundamental and technical analysis. The fundamental insight underlying sentiment based strategies is elegantly simple yet empirically robust. When market participants become uniformly bullish, marginal buyers become exhausted and the probability of price declines increases substantially. Conversely, when pessimism reaches extreme levels, forced selling creates attractive entry points for patient capital. Bank of America research found that their Bull and Bear Indicator generated a remarkable track record when deployed as a contrarian signal, with extreme fear readings historically preceding positive forward returns in equity markets (Bank of America Global Research, 2020). The Aggregate Bull and Bear Index applies this same contrarian logic while adapting the methodology to accommodate the data constraints facing individual investors.
For institutional investors operating with fiduciary responsibilities and substantial capital, the Aggregate Bull and Bear Index serves as one input among many in comprehensive risk management frameworks. Large asset managers might use extreme readings to trigger portfolio review processes, stress testing exercises, or adjustments to tactical allocation overlays. The indicator proves particularly valuable when it diverges from consensus expectations, as such divergences often precede meaningful market inflections. Hedge fund managers implementing systematic strategies can incorporate the index as a conditioning variable that adjusts position sizing or strategy weights based on the prevailing sentiment environment.
The integration of sentiment analysis into investment practice finds support in the concept of informational efficiency and the limits thereof. While efficient market hypothesis suggests that prices reflect all available information, the behavioral finance literature demonstrates that information processing by market participants exhibits systematic biases that create temporary mispricings (Barberis and Thaler, 2003). Sentiment indicators capture the psychological dimension of this information processing, providing insight into how market participants collectively interpret and react to fundamental developments. Extreme sentiment readings often indicate that psychological factors have pushed prices away from levels justified by fundamentals alone, creating opportunities for those willing to act against prevailing market opinion.
Practical Implementation for Individual Investors
The practical implementation of the indicator follows straightforward principles that both sophisticated institutions and individual retail traders can apply within their existing investment frameworks. When the index falls into the extreme fear zone below a reading of two, this suggests that market participants have become excessively pessimistic and that risk assets may offer favorable risk reward characteristics. Traders might consider this an opportune moment to increase equity exposure or reduce hedging positions. When the index rises into the extreme greed zone above eight, the opposite dynamic applies and a defensive posture becomes prudent. This could manifest as reducing equity allocations, increasing cash reserves, or implementing protective hedging strategies. The neutral zone between these extremes suggests no strong directional bias from a sentiment perspective, during which time other analytical frameworks should take precedence in decision making.
Individual retail investors can derive substantial benefit from the indicator even without sophisticated infrastructure or large capital bases. The most straightforward application involves treating extreme readings as alerts that warrant careful examination of existing portfolio positioning. A reading in the extreme fear zone might prompt consideration of whether recent market declines have created opportunities to deploy excess cash or rebalance toward equities. A reading in the extreme greed zone could trigger review of whether current equity exposure exceeds target allocations and whether risk reduction measures merit consideration. Importantly, the indicator should inform rather than dictate investment decisions, serving as one valuable perspective within a broader analytical framework.
Retail investors frequently find themselves at a psychological disadvantage during market extremes because emotional responses to portfolio losses or gains often prompt actions contrary to long term wealth accumulation. The academic literature on investor behavior consistently documents that individual investors tend to buy near market peaks when confidence runs highest and sell near market bottoms when fear dominates (Barber and Odean, 2000). A systematic sentiment indicator provides an objective framework for recognizing these emotional extremes and consciously acting against natural psychological impulses. By externalizing the assessment of market mood into a quantifiable metric, investors create psychological distance from their own emotional state and gain perspective on the collective sentiment environment.
The decision to implement a sentiment indicator within an investment process requires thoughtful consideration of how it complements existing analytical approaches. Technical analysts may find that sentiment readings help contextualize chart patterns and momentum signals, with extreme fear adding conviction to bullish technical setups and extreme greed warranting caution even when price trends appear strong. Fundamental investors can use sentiment as a timing tool that helps avoid the common mistake of being right on valuation but wrong on timing. Quantitative investors might incorporate sentiment factors into multi factor models or use them to adjust position sizing across strategies.
Trading Behavior and Strategy Characteristics
The Aggregate Bull and Bear Index employs a contrarian investment methodology that fundamentally diverges from trend following approaches prevalent in systematic trading. The trading logic rests upon the principle of accumulating positions when collective fear pervades market sentiment and liquidating those positions when greed dominates investor psychology. This approach stands in direct opposition to momentum strategies that amplify existing market movements rather than positioning against them.
The observation that the indicator frequently initiates long positions despite subsequent downward price movement represents not a flaw but an inherent characteristic of contrarian strategies. When the indicator signals extreme fear, this indicates that market participants have already engaged in substantial selling and pessimistic expectations have become embedded in asset prices. However, this emphatically does not guarantee that the ultimate trough has been reached. Fear can intensify, panic selling can escalate, and fundamental deterioration can trigger additional price declines before stabilization occurs. The indicator identifies phases where the statistical probability distribution of future returns appears favorable rather than pinpointing exact inflection points. Academic research by De Bondt and Thaler (1985) demonstrated that markets systematically overreact to both positive and negative information, creating opportunities for patient contrarian investors willing to endure interim volatility.
Risk Profile and Investment Considerations
This characteristic produces a distinctive risk profile that investors must thoroughly comprehend before implementation. The primary danger manifests in what practitioners colloquially term catching a falling knife. Purchasing assets during declining markets exposes capital to potentially severe interim drawdowns even when the ultimate investment thesis proves correct. The backtest evidence reveals numerous instances where positions experienced double digit percentage declines before eventually generating positive returns or triggering exit signals. Investors lacking the psychological fortitude to maintain positions through such adversity will inevitably abandon the strategy at precisely the wrong moment, crystallizing losses that patient adherents would have recovered. Behavioral research by Odean (1998) documented that individual investors exhibit a strong disposition effect, holding losing positions too long in some contexts while selling winners prematurely, yet paradoxically abandoning systematic strategies during drawdowns when discipline matters most.
The temporal dimension of contrarian investing demands particular attention. Unlike trend following strategies that can generate returns relatively quickly by riding established momentum, contrarian approaches often require extended holding periods before mean reversion materializes. The indicator may signal fear and initiate positions that subsequently experience weeks or months of continued decline before sentiment shifts and prices recover. This extended timeline conflicts with human psychological preferences for immediate gratification and creates substantial opportunity for doubt and strategy abandonment. Investors must recognize that the strategy optimizes for terminal wealth accumulation over extended horizons rather than minimizing short term discomfort.
A critical risk factor involves the possibility of genuine regime changes that invalidate historical relationships. While extreme fear readings have historically preceded favorable forward returns, this pattern assumes that pessimism eventually proves excessive and fundamentals stabilize or improve. In scenarios involving structural economic transformation, permanent impairment of earnings power, or systemic financial crisis, fear may prove entirely justified rather than excessive. The indicator cannot distinguish between irrational panic creating buying opportunities and rational recognition of deteriorating fundamentals. This limitation underscores the importance of using the indicator as one input among many rather than as a standalone decision mechanism.
Risk management applications deserve particular attention given the indicator's historical tendency to signal market stress before price declines fully materialize. Portfolio managers charged with protecting capital during drawdowns can use rising greed readings as an early warning system that justifies defensive measures such as reducing beta exposure, increasing cash allocations, or purchasing portfolio protection through options strategies. The contrarian nature of the indicator means that protective action occurs when markets appear strongest rather than weakest, avoiding the common trap of implementing risk reduction after substantial losses have already occurred.
Opportunity Set and Compounding Benefits
The opportunity set presented by contrarian sentiment investing derives from persistent behavioral biases that academic research has extensively documented. Extrapolation bias leads investors to assume recent trends will continue indefinitely, causing excessive optimism after gains and excessive pessimism after losses (Greenwood and Shleifer, 2014). Herding behavior amplifies these tendencies as investors observe and mimic the actions of others, creating self reinforcing cycles of buying or selling that push prices away from fundamental values. The Aggregate Bull and Bear Index systematically exploits these patterns by positioning against the prevailing emotional consensus.
The compounding benefits of buying during fear merit emphasis. When the indicator signals extreme pessimism, asset prices by definition trade at depressed levels relative to recent history. Investors who accumulate positions at these reduced valuations capture not only potential price recovery but also enhanced long term compound returns from reinvesting dividends and earnings at favorable prices. This mathematical advantage compounds over decades, explaining why legendary investors from Benjamin Graham to Warren Buffett have emphasized the importance of purchasing during periods of market distress despite the psychological difficulty such actions entail.
Investor Suitability and Implementation Requirements
Regarding suitability, the Aggregate Bull and Bear Index aligns most appropriately with investors possessing specific characteristics. First, a genuinely long term investment horizon measured in years rather than months proves essential. The strategy will underperform during extended bull markets when momentum approaches dominate and will experience painful interim drawdowns during crisis periods. Only investors capable of maintaining positions through these challenging phases will capture the strategy's full return potential. Second, psychological resilience to act against consensus and tolerate portfolio volatility represents a prerequisite. Research by Goetzmann and Kumar (2008) demonstrated that most individual investors lack the temperament for contrarian strategies despite their theoretical appeal. Third, sufficient financial reserves to avoid forced liquidation during drawdowns ensures that temporary price declines do not become permanent capital impairment.
The indicator proves less suitable for investors seeking steady returns with minimal volatility, those with short investment horizons or imminent liquidity needs, and individuals whose emotional responses to portfolio fluctuations compromise rational decision making. Institutional investors with quarterly performance pressures may find the strategy incompatible with their governance constraints despite its long term merits. Retirees depending on portfolio withdrawals must carefully consider whether interim drawdowns could force disadvantageous liquidations.
For appropriate investors, the Aggregate Bull and Bear Index offers a systematic framework for implementing time tested contrarian principles that have generated superior long term returns across multiple market cycles. By externalizing sentiment assessment into an objective metric, the indicator helps investors overcome the natural human tendency to capitulate at market bottoms and chase performance at market tops. The strategy demands patience, discipline, and genuine long term orientation, but rewards those characteristics with the potential for meaningful wealth accumulation over extended investment horizons.
Proprietary Elements and Limitations
The proprietary aspects of the indicator's construction reflect both practical and theoretical considerations. From a practical standpoint, maintaining certain methodological details as proprietary preserves the informational advantage that the indicator provides and prevents degradation of signal quality that might occur if widespread adoption prompted market participants to trade directly against the underlying components. From a theoretical perspective, the specific parameter choices and weighting schemes represent empirical findings from extensive research that constitute intellectual property developed through substantial effort.
Academic research on sentiment indicators provides encouraging evidence regarding their predictive value while appropriately acknowledging limitations. Baker and Wurgler (2006) demonstrated that investor sentiment predicts the cross section of stock returns, with high sentiment periods followed by lower returns for speculative stocks prone to overvaluation during euphoric conditions. Brown and Cliff (2005) found that sentiment measures contain information about near term market returns beyond that captured by traditional risk factors. However, the same literature cautions that sentiment signals exhibit variable lead times and occasional false positives, reinforcing the importance of using such indicators as part of comprehensive analytical frameworks rather than standalone trading systems.
The Aggregate Bull and Bear Index ultimately represents an attempt to bridge the gap between institutional grade sentiment analysis and the tools available to broader investor populations. By providing a systematic framework for assessing collective market psychology, the indicator empowers users to recognize emotional extremes and consider contrarian positioning when conditions warrant. The historical tendency of markets to reverse from extreme sentiment readings creates opportunities for those willing to act against crowd psychology, while the indicator's multi factor construction and quality filters help distinguish genuine extremes from temporary fluctuations. Whether deployed by professional money managers seeking to refine risk management practices or individual investors striving to overcome behavioral biases, the Aggregate Bull and Bear Index offers a valuable perspective on the eternal struggle between fear and greed that drives financial markets.
References
Baker, M. and Wurgler, J. (2006) Investor sentiment and the cross section of stock returns. The Journal of Finance, 61(4), pp. 1645 to 1680.
Bank of America Global Research (2020) The Bull and Bear Indicator: A contrarian timing tool. Bank of America Securities Research Report.
Barber, B.M. and Odean, T. (2000) Trading is hazardous to your wealth: The common stock investment performance of individual investors. The Journal of Finance, 55(2), pp. 773 to 806.
Barberis, N. and Thaler, R. (2003) A survey of behavioral finance. Handbook of the Economics of Finance, 1, pp. 1053 to 1128.
Brown, G.W. and Cliff, M.T. (2005) Investor sentiment and asset valuation. The Journal of Business, 78(2), pp. 405 to 440.
De Bondt, W.F.M. and Thaler, R. (1985) Does the stock market overreact? The Journal of Finance, 40(3), pp. 793 to 805.
Goetzmann, W.N. and Kumar, A. (2008) Equity portfolio diversification. Review of Finance, 12(3), pp. 433 to 463.
Greenwood, R. and Shleifer, A. (2014) Expectations of returns and expected returns. The Review of Financial Studies, 27(3), pp. 714 to 746.
Hartnett, M. (2019) Flow Show: Bull and Bear Indicator methodology and applications. Bank of America Merrill Lynch Investment Strategy.
Kahneman, D. and Tversky, A. (1979) Prospect theory: An analysis of decision under risk. Econometrica, 47(2), pp. 263 to 291.
Odean, T. (1998) Are investors reluctant to realize their losses? The Journal of Finance, 53(5), pp. 1775 to 1798.
Shiller, R.J. (2000) Irrational Exuberance. Princeton University Press.
Risk Appetite Index What This Indicator Does
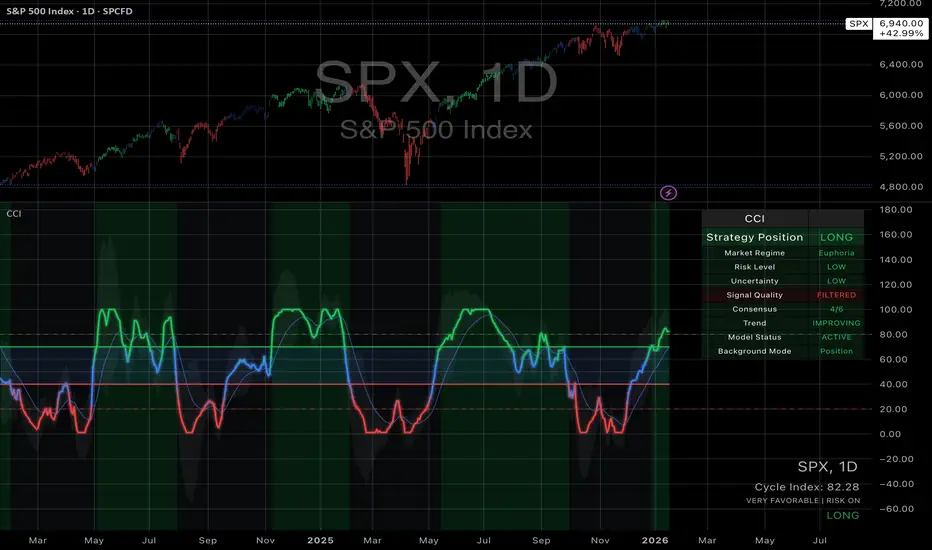
The Risk Appetite Index measures market participants' willingness to take risk by analyzing multiple market factors. This indicator attempts to provide insights into overall market sentiment by combining information from different market segments into a single composite measure.
How It Works
The indicator uses a multi-factor approach that examines various aspects of market behavior including equity market conditions, interest rate environments, credit markets, volatility patterns, and other relevant market data. These factors are processed and combined to create a composite reading on a 0-100 scale.
Theoretical Foundation
The methodology is grounded in established financial theories including Modern Portfolio Theory principles for risk assessment, behavioral finance concepts regarding market sentiment cycles, and factor investing approaches for multi-dimensional market analysis. The indicator incorporates insights from academic research on market microstructure, volatility clustering phenomena, and cross-asset correlation patterns during different market regimes.
The approach draws from research on fear and greed cycles in financial markets, term structure modeling, and credit risk assessment methodologies. Statistical techniques employed include robust normalization methods and composite index construction principles established in econometric literature.
The methodology employs statistical techniques to normalize the different market inputs and reduce the impact of extreme values. The final output aims to reflect the general level of risk appetite present in financial markets.
Signal Interpretation
Values above 60 may suggest higher risk appetite conditions in markets. Values below 30 may indicate lower risk appetite environments. The 30-60 range represents neutral or mixed conditions where market sentiment may be unclear.
The indicator includes threshold levels that may help identify potential changes in market conditions. However, like all technical indicators, these levels should be considered as potential reference points rather than definitive signals.
Research Context
The approach builds upon established sentiment measurement methodologies documented in financial literature, including studies on VIX-based fear indicators, credit spread analysis, yield curve interpretation, and cross-asset momentum research. The multi-factor design reflects principles from academic research on composite economic indicators and systematic risk assessment frameworks used by central banks and institutional investors.
The threshold-based signal generation follows established precedents in quantitative finance research regarding regime detection and market state classification methodologies documented in institutional portfolio management literature.
Key Features
Analytics Dashboard: Displays real-time information about current readings, market regime assessment, and signal quality indicators.
Visual Tools: Multiple color schemes and background options to help visualize current market conditions and trends.
Alert System: Optional alerts for threshold crossings and regime changes to help monitor market conditions.
Quality Assessment: Built-in filters attempt to distinguish between higher and lower confidence readings based on data quality and market conditions.
How to Use
This indicator is designed to be used on daily timeframes and displays in a separate panel below the main chart. It works best when used as part of a comprehensive market analysis approach rather than as a standalone trading tool.
The dashboard provides additional context about current readings and may help users understand the quality and reliability of current signals. Users should consider multiple factors and conduct their own analysis when making trading decisions.
Important Considerations
This indicator is designed for educational and analytical purposes. It does not guarantee profitable trading results and should not be used as the sole basis for trading decisions.
Market conditions can change rapidly and unpredictably. Past behavior of any indicator does not predict future market movements. All trading involves substantial risk and may not be suitable for all investors.
The indicator's effectiveness may vary across different market environments and conditions. Users should consider their own risk tolerance and investment objectives when using any analytical tool.
Data Limitations
The indicator relies on multiple external data sources and may be affected by data quality, market holidays, or limited trading hours. Performance may vary during unusual market conditions or structural changes in financial markets.
Like all quantitative models, this indicator has inherent limitations and may not capture all relevant market factors or unprecedented market events.
Intended Use
This indicator may be useful for traders and analysts seeking additional tools for market sentiment analysis. It is designed for those who want to incorporate multiple market factors into their decision-making process.
Academic Research Foundation
The development approach incorporates established research methodologies from quantitative finance literature. Key theoretical frameworks include:
Factor Models: Based on research into multi-factor asset pricing models and their application to portfolio construction and risk management practices developed in academic finance literature.
Behavioral Finance: Incorporates findings from behavioral economics research on market anomalies, investor psychology, and sentiment-driven market movements as documented in financial psychology studies.
Market Microstructure: Utilizes principles from market microstructure research regarding information flow, price discovery mechanisms, and cross-market relationships established in institutional finance literature.
Risk Management: Built upon established risk measurement frameworks including Value at Risk methodologies, stress testing approaches, and systematic risk assessment techniques documented in risk management research.
Econometric Methods: Employs statistical techniques based on time series analysis, robust estimation methods, and composite index construction principles established in econometric literature and central bank research methodologies.
The proprietary methodology combines various market inputs in an attempt to provide insights into overall risk appetite trends, though results may vary and should always be considered alongside other forms of analysis.
Risk Warnings
Past performance does not guarantee future results. All trading involves substantial risk of loss. This indicator does not eliminate market risk and should be used as part of a comprehensive trading plan. Market conditions can change rapidly and unexpectedly. No indicator is accurate in all market conditions.
Technical Requirements
Optimal use on daily charts with TradingView Pro or higher for real-time data access. Designed primarily for US equity market analysis during regular trading hours.
Note: This is a closed-source indicator with proprietary calculation methods designed to maintain effectiveness and provide users with a unique analytical tool. Credit Cycle Index The Credit Cycle Index represents a systematic approach to measuring financial market conditions through the aggregation of multiple credit and risk metrics. This indicator draws conceptual inspiration from academic research on credit cycles and their relationship to asset returns, building on the work of Gilchrist and Zakrajsek (2012) who demonstrated that credit spreads contain significant predictive information about economic activity and equity market performance. The indicator synthesizes publicly available market data into a unified framework that captures shifts in financial conditions before they become apparent in price action.
The theoretical foundation of credit cycle analysis rests on decades of research documenting the relationship between credit market conditions and asset returns. Bernanke and Gertler (1995) established the credit channel of monetary policy transmission, demonstrating how financial conditions amplify and propagate economic shocks through the broader economy. Schularick and Taylor (2012) documented how credit growth and credit conditions historically preceded major market dislocations, while Krishnamurthy and Muir (2017) showed that credit market variables exhibit predictable cyclical patterns that correlate with subsequent equity returns. These empirical findings suggest that monitoring credit conditions provides valuable information about the risk environment facing investors.
Unlike sentiment indicators that employ contrarian logic based on the assumption that crowd psychology overshoots at extremes, the Credit Cycle Index operates on regime-based principles. Credit market conditions tend to persist rather than mean-revert quickly. Favorable credit conditions typically support continued risk asset performance, while deteriorating conditions often precede extended periods of weakness. This approach recognizes that credit cycles operate on different timescales than sentiment cycles and require different strategic responses.
Methodology and calculation framework
The methodology underlying the Credit Cycle Index incorporates statistical normalization techniques that transform raw market data into comparable standardized scores. Each component factor undergoes robust calculation using median absolute deviation to reduce sensitivity to outliers, a technique that proves particularly valuable during market stress when traditional standard deviation measures become unreliable. These normalized components aggregate using a weighting scheme that adjusts dynamically based on prevailing market conditions, with stress-sensitive components receiving increased weight during periods of elevated market vulnerability.
The model produces values on a scale from zero to one hundred, where higher readings indicate favorable financial conditions and lower readings signal deteriorating conditions. Readings above seventy suggest healthy credit environments where risk assets typically perform well. The zone between forty and seventy represents normal conditions without strong directional bias. Readings below forty indicate meaningful stress, with values below twenty signaling crisis-level conditions across multiple components.
The model incorporates quality filters designed to enhance signal reliability. A consensus filter examines whether multiple underlying components align in the same direction, adding weight to signals when broad agreement exists across different market factors. A momentum filter requires positive index momentum to persist for a minimum duration before confirming entry signals, preventing premature positioning during temporary rebounds within deteriorating environments. These refinements reduce the probability of acting on spurious readings.
Professional application and portfolio integration
Professional portfolio managers recognize the value of credit condition indicators as tools for risk management and tactical allocation. The fundamental insight underlying credit-based strategies is empirically robust: favorable credit conditions create supportive environments for risk assets, while deteriorating conditions warrant defensive positioning. Lopez-Salido, Stein and Zakrajsek (2017) found that credit market sentiment significantly predicts economic activity and asset returns, with their research suggesting that credit conditions lead equity market performance by several months.
For institutional investors operating with fiduciary responsibilities, the Credit Cycle Index serves as one input in risk management frameworks. Asset managers might use deteriorating readings to trigger portfolio review processes, stress testing exercises, or adjustments to tactical allocation overlays. The indicator proves valuable when it diverges from prevailing market narratives, as such divergences often precede meaningful market inflections. Systematic investors can incorporate the index as a conditioning variable that adjusts position sizing based on the prevailing credit environment.
The integration of credit analysis into investment practice finds support in the concept that credit markets often lead equity markets in recognizing fundamental shifts. Credit market participants including bond investors and lenders frequently possess informational advantages regarding corporate financial health and economic conditions. When credit conditions deteriorate, this often reflects information that has not yet fully incorporated into equity prices, creating opportunities for investors who monitor these signals systematically.
Practical implementation for individual investors
The practical implementation of the indicator follows straightforward principles. When the index rises into the favorable zone above seventy with quality filter confirmation, this suggests credit conditions support risk asset exposure. When the index falls below the caution threshold of forty, defensive positioning becomes appropriate. This could manifest as reducing equity allocations, increasing cash reserves, or implementing protective strategies. The zone between these thresholds suggests balanced conditions where other analytical frameworks should take precedence.
Individual investors can derive benefit from the indicator by treating readings as alerts warranting examination of portfolio positioning. A reading in the favorable zone might prompt consideration of whether current equity exposure aligns with target allocations. A reading in the stress zone could trigger review of whether risk reduction measures merit consideration. The indicator should inform rather than dictate investment decisions, serving as one perspective within a broader analytical framework.
The decision to implement a credit condition indicator within an investment process requires consideration of how it complements existing approaches. Fundamental investors can use credit readings to assess whether the risk environment supports their positioning. Technical analysts may find that credit conditions help contextualize price patterns, with favorable conditions adding conviction to bullish setups and deteriorating conditions warranting caution. Quantitative investors might incorporate credit factors into multi-factor models or use them to adjust position sizing.
Trading behavior and strategy characteristics
The Credit Cycle Index employs a regime-following methodology that differs from both trend following and contrarian approaches. The trading logic accumulates positions when credit conditions indicate favorable environments and reduces exposure when conditions deteriorate. This approach positions with prevailing credit market signals rather than against them, recognizing that credit conditions exhibit persistence.
The observation that the indicator may signal favorable conditions while price volatility continues represents an inherent characteristic of regime-based strategies. When the indicator signals favorable conditions, this indicates that underlying credit metrics remain supportive despite surface-level price fluctuations. The indicator identifies phases where credit fundamentals support risk positioning, though short-term price movements may deviate from this underlying support.
Potential users should understand this behavioral characteristic before implementation. The strategy will maintain risk exposure during favorable credit conditions even when equity prices experience temporary weakness. It will advocate defensive positioning during credit deterioration even when equity prices appear stable. Success requires trust in the underlying credit signals and willingness to accept that price action and credit conditions may temporarily diverge.
Suitability and implementation requirements
The Credit Cycle Index aligns appropriately with investors possessing specific characteristics. First, a medium to long term investment horizon proves essential. Credit cycles operate over weeks to months rather than days, and the strategy requires patience to capture regime shifts. Second, a risk management orientation that prioritizes avoiding large drawdowns suits the defensive nature of the indicator during stress periods. Third, comfort with systematic decision making helps maintain discipline when credit signals conflict with prevailing market narratives.
The indicator proves less suitable for day traders seeking intraday signals, investors who prefer purely contrarian approaches, those requiring constant market exposure regardless of conditions, and individuals unable to tolerate periods when the indicator conflicts with price momentum. Institutional investors with strict benchmark tracking requirements may find the strategy incompatible with their mandates despite its risk management merits.
For appropriate investors, the Credit Cycle Index offers a systematic framework for monitoring financial conditions and adjusting risk exposure accordingly. By providing an objective assessment of credit market health, the indicator helps investors recognize environment shifts and consider positioning adjustments when conditions warrant. The strategy demands patience and discipline but rewards those characteristics with the potential for improved risk-adjusted returns through drawdown reduction during stress periods.
References
Ang, A. and Timmermann, A. (2012) Regime changes and financial markets. Annual Review of Financial Economics, 4, pp. 313 to 337.
Bernanke, B.S. and Gertler, M. (1995) Inside the black box: The credit channel of monetary policy transmission. Journal of Economic Perspectives, 9(4), pp. 27 to 48.
Campbell, J.Y. and Thompson, S.B. (2008) Predicting excess stock returns out of sample: Can anything beat the historical average? The Review of Financial Studies, 21(4), pp. 1509 to 1531.
Collin-Dufresne, P., Goldstein, R.S. and Martin, J.S. (2001) The determinants of credit spread changes. The Journal of Finance, 56(6), pp. 2177 to 2207.
Gilchrist, S. and Zakrajsek, E. (2012) Credit spreads and business cycle fluctuations. American Economic Review, 102(4), pp. 1692 to 1720.
Hamilton, J.D. (1989) A new approach to the economic analysis of nonstationary time series and the business cycle. Econometrica, 57(2), pp. 357 to 384.
Krishnamurthy, A. and Muir, T. (2017) How credit cycles across a financial crisis. NBER Working Paper No. 23850.
Lopez-Salido, D., Stein, J.C. and Zakrajsek, E. (2017) Credit-market sentiment and the business cycle. The Quarterly Journal of Economics, 132(3), pp. 1373 to 1426.
Merton, R.C. (1974) On the pricing of corporate debt: The risk structure of interest rates. The Journal of Finance, 29(2), pp. 449 to 470.
Schularick, M. and Taylor, A.M. (2012) Credit booms gone bust: Monetary policy, leverage cycles, and financial crises, 1870 to 2008. American Economic Review, 102(2), pp. 1029 to 1061.
Volatility Term Structure Index Volatility Term Structure Index
The Volatility Term Structure Index represents a systematic approach to measuring market stress and complacency through the analysis of volatility derivatives and their term structure relationships. This indicator draws conceptual inspiration from academic research on volatility forecasting and the informational content embedded in options markets.
The theoretical foundation rests on decades of research documenting the relationship between implied volatility patterns and subsequent market returns. Black (1976) first documented the inverse relationship between equity returns and volatility changes, establishing a fundamental principle in financial economics. Whaley (2000) demonstrated how volatility indices reflect aggregate market fear and uncertainty, with systematic patterns preceding major market dislocations. Engle (2004) provided foundational work on volatility modeling that underpins modern risk measurement approaches.
Unlike momentum strategies that follow price trends or contrarian approaches that bet against prevailing sentiment, this indicator operates on regime-identification principles. The relationship between short-term and long-term implied volatility reveals market expectations about risk evolution. When markets expect calm conditions to persist, the volatility term structure typically exhibits an upward slope. When stress emerges, this relationship inverts as near-term uncertainty exceeds longer-term expectations. This structural information reflects the aggregate positioning of sophisticated derivatives market participants.
Methodology and calculation framework
The methodology incorporates statistical normalization techniques that transform raw volatility data into comparable standardized scores. Each component factor undergoes robust z-score calculation using median absolute deviation to reduce sensitivity to outliers, a technique that proves particularly valuable during market stress when traditional standard deviation measures become unreliable. These normalized components aggregate using a weighting scheme informed by historical predictive power and correlation characteristics.
The indicator produces values on a scale from zero to one hundred, where higher readings indicate calm market conditions and lower readings signal elevated stress. Readings above seventy suggest complacent environments where equity markets typically perform well. The zone between forty and seventy represents mixed conditions without strong directional bias. Readings below forty indicate meaningful stress, with values below twenty signaling crisis-level conditions.
Internal quality mechanisms enhance signal reliability by requiring confirmation across multiple underlying factors before generating actionable signals. This reduces the probability of acting on isolated or unreliable readings and improves overall signal consistency.
Professional application and portfolio integration
Professional portfolio managers recognize the value of volatility regime indicators for risk management and tactical allocation. The fundamental insight is empirically robust: periods of low and stable volatility create supportive environments for equities, while regime transitions and elevated uncertainty warrant caution. Bollerslev, Tauchen and Zhou (2009) found that variance risk premium significantly predicts equity market returns, with volatility conditions leading price performance.
For institutional investors, the index serves as one input in risk management frameworks. Asset managers might use deteriorating readings to trigger portfolio review processes, stress testing exercises, or tactical allocation adjustments. The indicator proves valuable when it diverges from consensus narratives, as volatility markets often recognize fundamental shifts before they appear in prices. Systematic investors can incorporate the index as a conditioning variable for position sizing.
This integration finds support in the concept that derivatives markets often lead equity markets. Options market participants including market makers and institutional hedgers frequently possess informational advantages regarding expected market movements and tail risk.
Practical implementation for individual investors
When the index rises into the favorable zone above seventy with confirmed signal quality, volatility conditions support equity exposure. When the index falls below forty, reducing allocations, increasing cash reserves, or implementing protective strategies becomes appropriate. The zone between these thresholds suggests mixed conditions where other analytical frameworks should take precedence.
Individual investors can treat readings as alerts warranting portfolio examination. A favorable reading might prompt consideration of whether current equity exposure aligns with targets. A stress reading could trigger review of risk reduction measures. The indicator should inform rather than dictate decisions, serving as one perspective within a broader analytical framework.
Fundamental investors can use volatility readings to assess whether the risk environment supports their positioning. Technical analysts may find that volatility conditions help contextualize price patterns. Quantitative investors might incorporate volatility factors into multi-factor models.
Trading behavior and strategy characteristics
The index employs a regime-based methodology identifying periods when market conditions favor risk exposure versus caution. The trading logic accumulates positions when volatility conditions indicate calm environments and reduces exposure when conditions deteriorate. This approach positions with prevailing volatility market signals, recognizing that volatility regimes exhibit meaningful persistence.
The indicator may signal favorable conditions while price fluctuations continue. This reflects underlying volatility metrics remaining supportive despite surface-level movements. The strategy maintains exposure during favorable volatility conditions even when prices experience temporary weakness, and advocates caution during volatility deterioration even when prices appear stable. Success requires trust in the underlying signals and acceptance that price action and volatility conditions may temporarily diverge.
Suitability and implementation requirements
The index aligns with investors possessing specific characteristics. A medium to long term horizon proves essential as volatility regimes operate over weeks to months. A risk management orientation that prioritizes avoiding large drawdowns suits the defensive nature during stress periods. Comfort with systematic decision making helps maintain discipline when signals conflict with market consensus.
The indicator proves less suitable for day traders, investors requiring constant market exposure, and those unable to tolerate periods when the indicator conflicts with price trends. Institutional investors with strict benchmark tracking requirements may find the strategy incompatible with their mandates.
For appropriate investors, the index offers a systematic framework for monitoring market conditions. By providing an objective assessment of volatility regime health, it helps recognize environment shifts and consider positioning adjustments. The strategy demands patience and discipline but rewards those characteristics with potential for improved risk-adjusted returns through drawdown reduction during stress periods.
References
Ang, A. and Chen, J. (2002) Asymmetric correlations of equity portfolios. Journal of Financial Economics, 63(3).
Black, F. (1976) Studies of stock price volatility changes. Proceedings of the 1976 Meetings of the American Statistical Association, Business and Economics Statistics Section.
Bollerslev, T., Tauchen, G. and Zhou, H. (2009) Expected stock returns and variance risk premia. The Review of Financial Studies, 22(11).
Engle, R. (2004) Risk and volatility: Econometric models and financial practice. American Economic Review, 94(3).
Whaley, R.E. (2000) The investor fear gauge. The Journal of Portfolio Management, 26(3).