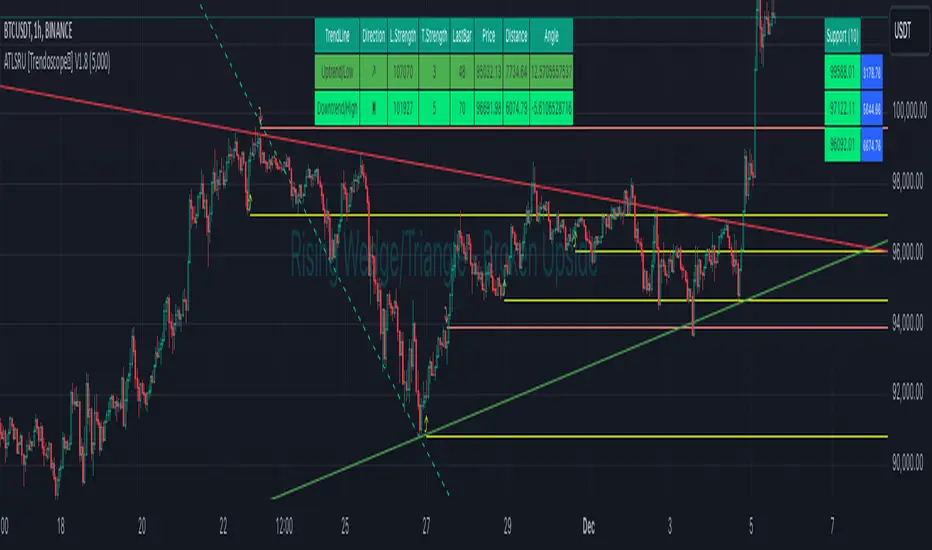
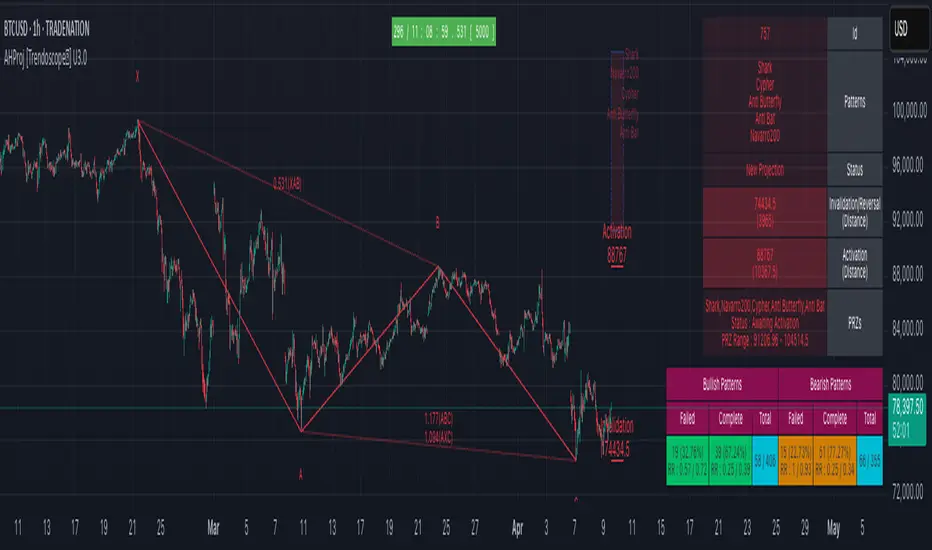
Это пространство с платным контентом Trendoscope. Теперь вы можете получить доступ к индикаторам пользователя напрямую на TradingView. Читайте подробнее о платном контенте Auto Chart Patterns - Ultimate [Trendoscope] Here is an attempt to gather and present stats and probabilities of different chart patterns. Here, we challenge few traditional biases such as rising wedge is bearish, falling wedge is bullish etc. All the chart patterns identified in this script are bi-directional. Meaning they offer opportunities to trade in either direction.
This indicator is built on the base of two free scripts
🎯 Wedge-and-Flag-Finder-Multi-zigzag
🎯 Trendline-Pairs-Deep-Search
🎲 Following are the major highlights/updates in the present script
▶ Uses the similar deep search algorithm for finding patterns. Pattern identification logic has been optimised to provide more accurate patterns.
▶ Provides suggestion on how to trade these patterns - along with entry, stop and target suggestions.
▶ Advanced options available in setting such as 'Safe Repaint' - which enables repaint only when trade has not started.
▶ Option to run algorithm within specified time window
▶ Comprehensive stats on historical patterns which include win ratio, risk reward, trailing win ratio and trailing risk reward.
▶ Open Trades Stats widget which can help tracking trades easily.
▶ Fully customisable alerts - which can be used to plugin into bots.
🎲 Chart Patterns Included
▶ Channel - Uptrend, Downtrend, Ranging
▶ Triangle - Expanding, Contracting
▶ Rising Wedge - Expanding, Contracting
▶ Falling Wedge - Expanding, Contracting
If unable to determine the type and yet pivots are inline to form two trend lines, then it goes to category - Indeterminate
🎲 Indicator Components
Below is a quick snapshot of indicator components.
Now, lets look at some of the individual components:
▶Open trade stats helps recognise trades in motion.
▶ Closed trade stats can either be shown with minimal stats or fully detailed stats.
🎲 Settings
▶ Generic Settings
▶ Zigzag and pattern selection
▶ Channel Settings
▶ Risk/Reward and Stats/Display Settings
🎲 Key Features
⬤ Safe Repaint :
This option allows redrawing pattern only if trade has not been taken. This increases accuracy of pattern detection. Example of impact of safe repaint is shows as below:
⬤ Trade Reversal or Breakout of Channels :
This option is useful to handle channels of different size. If the distance between channel trendlines are huge, then it is more advantageous to trade reversals. If the distance between trendlines of channel is small, it is more rewarding to trade the breakouts.
Here is an example of how this setting impacts the trade suggestions.
⬤ Detailed Closed Trade Stats :
Closed Stats settings give users option to see in depth details such as risk reward and win ratios for past patterns along with numbers.
⬤ Fully Customisable Alerts :
Alerts are implemented using alert method. Hence, users will not see text box in alert window where they can set alert format. To overcome this challenge, the indicator offers customisation of alerts through settings.
In the settings window, you notice below options for alerts
These settings allow users to enable/disable alerts for different status of patterns. The text box in the settings allows users to set customisable alert formats using specific placeholders.
Valid placeholders are:
{type} - Alert Type
{id} - Pattern id for which alert is generated
{ticker} - Ticker for which alert is generated
{timeframe} - Chart timeframe
{price} - Current close price
{pattern} - Name of the pattern
{longTrade} - Array containing stop, entry, target1 and target2 for long side of the trade for given pattern
{shortTrade} - Array containing stop, entry, target1 and target2 for short side of the trade for given pattern
{status} - Contains status of both long and short side of the trades as text
Default alert template set for all type of alerts is as below
{
"alert" : "{type}",
"id" : {id},
"ticker" : "{ticker}",
"timeframe" : "{timeframe}",
"price" : {price},
"pattern" : "{pattern}",
"long " : {longTrade},
"short " : {shortTrade},
"status" : "{status}"
}
An example alert looks like this:
If you just want to display pattern name and alert type, your alert message in the box should be something like this:
Type - {type}, Pattern - {pattern}
Will make a video on settings and usage when I get time :) Auto Harmonic Pattern - UltimateX [Trendoscope] IMPORTANT NOTE: (Read this before looking at any other thing on this indicator)
This indicator is created to supersede existing Auto-Harmonic-Pattern-Ultimate-Trendoscope invite only script. The script deviates a lot from the original Auto Harmonic Patterns Ultimate script in terms of number of available patterns, trading type and few other things. Hence, instead of updating the existing script, we have just decided to release as new script. Few FAQs in this regard are as below
What it means for users of AHPU and new users?
▶ Subscription of this script is not sold separately, but will be offered along with existing AHPU script. Meaning, there will be single subscription for both scripts together.
▶ All existing subscribers of AHPU will also get access to this script for the duration of their subscription term. Will start adding access to users starting from lifetime subscribers first.
▶ Any new subscriptions to AHPU will also get access to both the scripts together. We will eventually look to phase out existing AHPU once users are accustomed to new script and any possible bugs are resolved.
▶ Any trial requests will also get access to both scripts. You can request trial even if you have recently requested trial for AHPU.
Why did we create new script instead of updating the existing one?
▶ As mentioned before, this script deviates a lot from the original AHPU. Hence, it is released as new version to make sure smoother transition of users. If anyone is not comfortable using the new version, they can continue using the existing AHPU script until things settle down.
▶ Since the script is new implementation, it may also have initial bugs. It will help us resolve it in more streamlined way.
What are the main differences between these scripts?
▶ Uses single zigzag instead of multi as algorithm is further improved to detect almost everything using single zigzag.
▶ More number of patterns added. But, new patterns are disabled by default as some of them have very wide PRZ. Users can enable it via settings.
▶ Trading type with trailing entry - With wide PRZs, we also had to implement different method for calculating entry/stop. This is explained later in the script.
▶ Matrix implementation and enhanced stats - Entire implementation is redesigned to use matrix data structure instead of arrays. This allows lots of possibilities including enhanced closed trade stats.
▶ Support/Resistance widget is removed as it is proving to be bit of overhead. Users can make use of Support Resistance widget script which is a free to use script instead.
Let's get to the details of indicator now.
🎲 Indicator Components
🎯 Patterns Covered
● Classic Patterns
Gartley
Bat
Butterfly
Crab
Deep Crab
Cypher
Shark
Nenstar
● Anti/Alternate Patterns
Anti Nenstar
Anti Shark
Anti Cypher
Anti Crab
Anti Butterfly
Anti Bat
Anti Gartley
Navarro200
● Non-Standard Patterns (Disabled by default)
Five Zero
Three Drives
White Swan
Black Swan
Sea Pony
Leonardo
121
Snorm
Total
Below is a quick snapshot of indicator components.
Now, lets look at some of the individual components:
🎯 Open trade stats helps recognise trades in motion.
Apart from regular stats, it also contain different types of risk reward ratios.
Regular RR : RR calculated from entry to reach target with initial stop for risk consideration
Trailing RR : This is RR calculated for price to reach from one target to next target considering trailing stop for calculating risk
Live RR : This is calculated based on current price as entry and with given targets and stop levels. Live RR will be blank for targets which are already reached.
Targets are calculated only when entry is made. Hence, target details are not shown for patterns where it is still awaiting entry.
🎯 Closed trade stats helps understand historical performance of patterns.
By default closed stats are displayed in Compact mode. Which means, only total stats are shown. But, users can change this to show detailed stats via settings. Detailed stats take up entire screen most of the time. So, keep them only if it is required.
Closed stats present average Risk Reward, Trailing Risk Reward, Average Win Rate, and Average Trailing Win Rate for all the possible levels. As discussed before.
Regular RR : RR calculated from entry to reach target with initial stop for risk consideration
Trailing RR : This is RR calculated for price to reach from one target to next target considering trailing stop for calculating risk
Win Rate : Simple win rate calculation based on number of patterns reached target and number of valid patterns.
Trailing Win Rate : This is win rate calculated based on previous target to current target.
For example, if there are 48 valid patterns and out of which 24 patterns reach target1 and 12 patterns out of 24 reach target 2
Target1 WR : 50% (24/48)
Target1 TWR : Not applicable as there is no target before Target1
Target2 WR : 25% (12/48)
Target2 TWR : 50% (12/24)
🎲 Settings
Tooltips are provided to help with each and every settings. And they are as below.
🎲 Fully Customisable Alerts - Placeholders
Alerts are created via alert() method of pine. Hence, users will not see message box for alert template on alert widget.
Instead alerts widget look something like this:
To overcome this issue, script provides alert template placeholders as part of settings. In settings, you can already see Alert section where you can enable/disable alerts for different events.
▶ New Pattern Detection
▶ Entry Reached
▶ Target1-4 Reached
▶ Stop price reached
▶ Trade Complete - either by stop or reaching target 4
You can use following placeholders in the given text boxes to create your own alert template.
🎯 Common placeholders which are applicable for all alerts
{type} - Alert Type
- New Harmonic Pattern
- Harmonic Pattern Status Update
- Harmonic Pattern Trade Closure
{id} - Pattern Id. This is not fully unique id. But, this will be unique for all open trades. Once trade is closed, Ids are reused whenever feasible.
{ticker} - Ticker information
{timeframe} - Timeframe information
{price} - Current close price
{patterns} - Possible patterns for the projections or PRZ.
{direction} - Trade direction - Bullish or bearish
{entry} - Calculated entry for pattern
{stop} - Calculated stop for pattern
{tstop} - Trailing stop for the pattern in trade
{target1} - Target1 for pattern in trade
{target2} - Target2 for pattern in trade
{target3} - Target3 for pattern in trade
{target4} - Target4 for pattern in trade
🎯 There are few specific placeholders, which are applicable for some alert types.
Harmonic Pattern Status Update
{status} - Status of the Pattern in trade
{laststatus} - Previous status of the Pattern in trade
Harmonic Pattern Trade Closure
{result} - Trade result upon closure Auto Harmonic Projection - Ultimate [Trendoscope] Hello traders, Many who used Auto Harmonic Pattern - Ultimate had enquired with me about having option to project PRZ before patterns formed. We always replied that it is in pipeline but will not be part of existing script. Finally, we decided to utilise part of our Christmas and new year break to make it happen.
Lets get started..
⬜ Process
▶ Unlike Auto Harmonic Patterns Ultimate, instead of scanning whole XABCD for harmonic pattern, this script only collects XABC and projects PRZs (Possible D zones)
▶ Once possible patterns are found, lines are drawn to connect XABC and boxes to project PRZs. There can be more than 1 PRZs for XABC combination. If PRZs of multiple patterns overlap, they are joined and shown as single PRZ where all patterns are listed against it.
▶ If price crosses C, pattern is considered as failed. If price stays between C and PRZs for long time, patterns are timed out. In either case, patterns and projections are removed from chart.
▶ Pattern is considered to be active once price reach B. Until then Pattern is inactive.
▶ PRZs are tracked individually even if they belong to same pattern. PRZ is considered active only if price hits PRZ and completes the pattern. Till then PRZ is considered inactive.
▶ After activating, PRZs can either reach successful level if price moves in reversal direction. Or it can reach failure if price reaches stop.
▶ PRZs are removed from chart once it either reaches stop or success level. But, if more PRZs are present for pattern, pattern will still be there on chart.
▶ Pattern is kept active till all the PRZs are either hit stop or success or pattern itself is either failed or timed out.
Note:
Whenever we refer pattern - consider it as lines joining X, A, B, C and D if PRZ is active.
Wherever we refer PRZ - consider it as box representing potential reversal zones.
⬜ Screen components
▶ Inactive Patterns and PRZ - Patterns with inactive PRZs are represented as lines joining XABC. There will not be line connecting D and PRZs are shown with faded colour and smaller fonts.
▶ Active Patterns and PRZ - Patterns with active PRZ are represented with full pattern and line fills. PRZ will also show stop and success level. Note that success level is not target level - but a position used for validating the outcome.
▶ Stats table - Open stats table contains patterns and corresponding PRZ levels. Stats will have red background for bearish patterns/projections and green background for bullish patterns/projections. Content text colour is matched with that of PRZ and Pattern line colors so that users can identify the matching stats easily.
▶ Run timer - Tells how long the script backtest is running. Run timer will have red background for TRIAL access or if right access key is not used. Otherwise, it will have green background colour. This does not have much significance now as there are no closed stats available. It will be added in the future versions.
▶ Watermark - Watermark appears only if valid key is not used or TRIAL access key is used.
Bit more details about open stats table here
⬜ Settings
⚪ Alert Key
Alert key is given for active subscribers. This key is required in order to set alerts or in order to run the script for more than 30 bars on single instrument without interruption. Not having alert key will not stop users from using the indicator once they acquire access - but it will only limit few capabilities. Key is not given for trial access.
Key is prompted every time users add indicator to chart. If you are provided with key, please use it instead of the TRIAL access key.
If you are using valid key,
You will see run timer in green instead of red background
No TRIAL ACCESS watermark on the chart.
⚪ Zigzag and pattern detection settings
⚪ Pattern Selection settings
⚪ Stats and Display
⚪ Colors and themes
⚪ Backtest Settings
Not important for now as there are no closed pattern stats. Kept for future usage. Will impact the timer widget.
⚪ Alerts
▶ Types and settings
▶Setting alerts is simple. When indicator is loaded on chart (Make sure you are using the right alert key), goto alerts and select the AHProjection from Condition dropdown. Update other parameters such as alert name, webhook details as required and press create
▶ Examples of alerts
⬜ Status Tracking
Script tracks two types of statuses.
⚪ Harmonic Pattern Projection Status : Tracks projection as a whole for each combination of X, A, B, C. Different states available are
Awaiting Activation : Any pattern projection when formed by default goes into Inactive State and hence set to Awaiting Activation.
Projection Active : Once price reach B, then pattern projection is considered active
Entry Reached : Once price reach the nearest PRZ level, it is considered as Entry reached. Status will remain as entry reached even if PRZ is removed and next PRZ level is yet to be reached.
Projection Invalidated : If price goes beyond C level, then pattern projection is considered invalidated. It can happen at any stage and even after successful completion of few PRZ ranges.
Projection Timed Out : If price keeps between PRZ and C for considerable time, it will timed out and removed from chart.
⚪ Harmonic Pattern Projection PRZ Status Tracks individual PRZs separately which may or may not belong to same patterns. Different states available are
Awaiting Activation : Any PRZ is considered inactive before price reaching the PRZ level.
Active : Once price reaches PRZ, it will become active. Active PRZs are highlighted with line fill on chart. Active PRZ also display success and stop levels. PRZ is not removed unless price hits one of these levels or the entire pattern is timed out.
Successful : If an active PRZ price reaches success level, then PRZ projection is considered successful. Once successful, PRZ will removed from chart
Failed : If an active PRZ price reaches stop level, then PRZ projection is considered failure. Once failed PRZ will be removed from chart.
Auto Harmonic Pattern - Screener [Trendoscope] At Trendoscope, we take pride in offering a wide range of indicators on Harmonic Patterns, including both free and premium options. While we have successfully developed various advanced tools, we recognize that creating a Harmonic Pattern screener is an audacious endeavor that few have ventured into.
Creating a harmonic pattern screener presents a formidable challenge. The intricate nature of the algorithm, coupled with the limitations of cloud-based processing and platform memory, makes it exceedingly difficult to implement the screener functionality without encountering runtime errors.
Today marks a historic achievement as we overcome numerous challenges to unveil our groundbreaking harmonic pattern-based screener. This significant leap signifies our commitment to innovation in the field.
Without further delay, let's dive right into the new Auto Harmonic Pattern - Screener algorithm
🎲 Features Overview
🎯 Primary Functionality
We prefer not to categorize this as a traditional indicator, as it goes beyond that scope. Instead, it's a unique amalgamation of both a screener and an indicator, designed to achieve primarily two essential functions.
Firstly, it efficiently scans multiple tickers, up to 20, for harmonic pattern formations and presents them on a user-friendly dashboard
Secondly, it provides harmonic pattern drawings on the chart, but only if the current chart ticker is part of the screener and exhibits a harmonic pattern formation.
🎯 Secondary Features
In addition to its primary functionalities, our revolutionary algorithm offers an array of secondary features that cater to traders' diverse needs
Users have the privilege of accessing enhanced settings, providing limitless customization options for the zigzag and pattern detection algorithm
The platform empowers traders to effortlessly customize stop entry target ratios, facilitating automatic calculations and display of suggestions
The freedom to personalize the visualization and display of patterns and dashboard ensures a seamless and intuitive user experience
And finally, the algorithm leaves no stone unturned, keeping traders well-informed through timely alerts on every bar, highlighting tickers exhibiting Harmonic Pattern formations.
🎯 Limitations
Our innovative screener harnesses the power of the recursive zigzag algorithm to deliver efficient and accurate harmonic pattern detections. While the deep search algorithm, present in our other Harmonic Pattern algorithms, offers unparalleled precision, its resource-intensive nature makes it unsuitable for simultaneous scanning of 20 tickers. By focusing on the recursive zigzag approach, we strike the perfect balance between performance and functionality, ensuring seamless scanning across multiple tickers without compromising on accuracy. This strategic decision allows us to deliver a powerful and reliable screener that meets the diverse needs of traders and empowers them with real-time harmonic pattern insights.
🎲 Chart Components
Upon loading the indicator and configuring your tickers, our user-friendly interface offers two key components seamlessly integrated into the chart:
A color-coded screener dashboard : The dashboard presents a clear visualization of tickers with bullish and bearish harmonic patterns. This intuitive display allows you to quickly identify potential trading opportunities based on pattern formations.
Dynamic pattern display : As you interact with the chart, our algorithm dynamically highlights possible harmonic patterns based on the latest zigzag pivots. Please note that patterns may not always be visible on the chart, especially in cases where higher-level zigzags take time to form pivots. However, rest assured that our sophisticated algorithm ensures real-time updates, providing you with accurate and timely harmonic pattern insights.
🎯 Screener Dashboard
In our screener dashboard, you will find a wealth of information at your fingertips:
Bullish patterns : Tickers exhibiting bullish harmonic patterns are prominently highlighted with a refreshing green background
Bearish patterns : Similarly, tickers featuring bearish harmonic patterns stand out with a striking red background
Dual patterns : Tickers displaying both bullish and bearish patterns are cleverly highlighted in a captivating purple background, providing a comprehensive view of the harmonic pattern landscape.
Tickers without current patterns : Tickers lacking any current patterns are elegantly displayed with a silver background. These tickers do not trigger tooltips, streamlining your focus on actionable pattern-related data.
🎲 Settings in Detail
🎯 Tickers
Our platform currently allows users to select up to 20 tickers for the harmonic pattern screener. We understand the importance of flexibility and scalability, and while we are excited to accommodate more tickers in the future, our present focus is to ensure optimal performance within the CPU and memory limitations. Rest assured, we are continuously working on enhancing our capabilities to provide you with an even more comprehensive experience. Stay tuned for updates as we strive to meet your evolving needs.
🎯 Zigzag and Harmonic Pattern
In this section, we present a range of essential settings that play a pivotal role in the calculation of the zigzag and the scanning of patterns. These parameters share similarities with other premium indicators associated with Harmonic patterns. These settings serve as building blocks for our advanced algorithms' suite.
This include
Zigzag length and depth settings for calculation of the multi level recursive zigzag
Pattern scanning settings to filter patterns based on preferences of category, pattern name, accuracy of calculation, and other considerations.
User preference of pattern trading ratios that are used for calculating entry, stop and target prices.
🎯 Screener Dashboard and Alerts
In this section, we introduce the parameters that define the format and content of alerts and the screener dashboard, offering you maximum flexibility in customizing their display. These settings encompass the following key aspects:
Screener dashboard position, layout and size that influence the display of screener dashboard.
List of parameters that can be shown on dashboard tooltips as well as on alerts.
Format of alert and tooltip data
🎯 Pattern Display
These are the settings related to pattern display on the chart and to limit calculation to last n bars
Will soon make video tutorials on this soon. Converging Chart Patterns - Ultimate [Trendoscope®] 🎲 Introducing the Converging Chart Patterns Ultimate Indicator
Derived from the comprehensive capabilities of our premium offering, the Auto Chart Patterns - Ultimate , this new indicator focuses exclusively on converging chart patterns. It marks the beginning of a series that, over time, will encompass the full spectrum of chart pattern analysis, ultimately enhancing and expanding beyond the scope of Auto Chart Patterns.
This strategic separation into more focused indicators is designed to cater to traders seeking precision in specific chart pattern categories.
🎲 Leveraging Research and Open-Source Foundations
Our journey to this indicator has been paved by extensive research and the insights gained from our prior works on Chart Patterns, including:
Algorithmic Identification of Chart Patterns
Flag and Pennant Chart Patterns
Trading Converging Chart Patterns
Drawing upon the foundation laid by our publicly shared indicators - Auto Chart Patterns and Flags and Pennants - this tool is the culmination of our efforts to provide traders with a refined method for strategizing around converging patterns. It not only facilitates the development of technical trading strategies but also aids in evaluating their effectiveness through historical performance analysis. The specific patterns addressed by this indicator include:
Rising Wedge (Converging Type)
Falling Wedge (Converging Type)
Converging Triangle
Rising Triangle (Converging Type)
Falling Triangle (Converging Type)
🎲 Chart Pattern Scanning Methodology
The process of identifying converging chart patterns involves several key steps:
Begin by examining each zigzag for the last 5 or 6 pivot points to identify potential trend line pairs.
Determine if these trend lines are converging by projecting them forwards and checking for an intersection within a specified number of bars ahead.
Upon confirming convergence, categorize each pattern based on the directional orientation of its trend lines, as detailed in our article - Algorithmic Identification of Chart Patterns
🎲 Methodology or Trading for Chart Patterns
While traditional views assign specific trading biases to converging patterns (e.g., Rising Wedges as bearish and Falling Wedges as bullish, with Triangles being more versatile), empirical support for these assumptions is limited. Our indicator is designed to empower users to explore and validate various trading hypotheses, including unconventional ones, thereby not confining trading strategies to past market behaviors.
We enable extensive customization for testing different strategies, with the initial setup allowing for both long and short trading scenarios for each identified pattern. Users have the liberty to adjust trading directions and other parameters within the indicator's settings to suit their analytical needs.
This open approach is rooted in the methodology outlined in - Trading Converging Chart Patterns , exemplified by the following process, which users can adapt and refine through our indicator.
🎲 Overview of Indicator Components
The components of our indicator are illustrated in the chart below
Pattern Visualization : This feature dynamically displays the patterns on the chart, focusing on currently active patterns. To maintain clarity and performance, historical patterns are not shown due to the constraints of drawing objects.
Trading Annotations : The indicator marks open trades directly on the chart, accommodating both long and short positions depending on the user's settings and the current status of trades associated with each pattern.
Performance Metrics Table : A comprehensive table presents the back testing results for individual patterns as well as aggregated outcomes. It includes crucial metrics such as win rates and the profit factor based on the set risk-reward ratio, offering users valuable insights into the potential profitability of their configurations and trade strategies.
🎲 Exploring the Indicator's Customization Options
This indicator is rich in settings, offering users the capability to tailor criteria and adapt their trading rules. Each setting is accompanied by detailed tooltips, providing insights into their use. Let's examine each category systematically.
🎯 Zigzag Configuration Options
These settings enable users to adjust the scope of their pattern analysis by varying the zigzag's length and depth.
Length Adjustment : Modifying this parameter changes the scale of detected patterns, with higher values spotting larger formations and lower ones focusing on more compact patterns.
Depth Enhancement : This alters the intricacy of the recursive zigzag analysis, potentially unveiling larger patterns across several levels. Caution is advised, as excessive depth may lead to the indicator exceeding its processing capacity.
🎯 Pattern Scanning Settings
This suite of settings fine-tunes the pattern scanning process, generally calibrated for precise geometric alignment of identified patterns. While most settings may remain as default for routine use, users are encouraged to tweak them, especially the "Last Pivot Direction," to explore various theoretical approaches to pattern trading.
🎯 Trade Configuration Settings
Arguably the most crucial for users, these settings offer complete autonomy in defining trading strategies around converging chart patterns. This includes the flexibility to set entry, stop, and target prices, adjust risk-reward ratios, select the historical depth for back testing, and incorporate filters to steer trade direction.
🎯 Pattern Specific Settings
Here, users can personalize settings for individual patterns or groups, enhancing the specificity of their strategy. Apart from enabling/disabling individual patterns and pattern groups, users can also select pattern specific Last Pivot Direction, Trade Direction Filter and external filters for each pattern.
🎯 Fully Customizable Alerts
Implemented through the alert() function, these alerts bypass the standard template in the alert widget. To counteract this, we've introduced placeholders within the settings to craft detailed alert templates.
Available Categories Include
New - Alerts when a new pattern is identified
Entry - Alerts when an entry condition for configured pattern based trade is met.
Stop - Alerts when a trade that has reached entry gets stopped out without reaching target
Target - Alerts when a trade reaches its target
Invalidation - Alerts when a trade reaches invalidation point before reaching the entry.
Each alert types can have its own template. Customizable templates are very important in using alerts for broker or exchange integration.
Here are some of the placeholders that are defined in the indicator.
{type} - Alert type - new/entry/stop/target/invalid
{pid} - Pattern ID of the pattern belonging to trade. Multiple trades can have same pattern id since a pattern can be traded in both long and short directions.
{tid} - Unique Trade ID for the given trade.
{ticker} - Ticker ID on which the indicator is run
{timeframe} - Chart timeframe on which the indicator is run
{basecurrency} - Base currency of the symbol
{quotecurrency} - Quote currency of the symbol
{pivots} - Pivot values of the pattern
{price} - Current price when the alert is triggered.
{pattern} - Name of the pattern on which the alert is triggered.
{direction} - Direction of the trade.
{entrydirection} - Direction of the entry signal. Used for specific bot integration.
{exitdirection} - Direction of the exit signal. Used for specific bot integration.
{entry} - Entry price of the trade
{stop} - Stop price of the trade
{target} - Target price of the trade
{invalidation} - Invalidation price of the trade
🎯 Display and Stats
These settings are used to control the display options on the chart. Closed trade stats is displayed in a table and printed in the bottom left corner of the chart. This can be customized by using display settings.
Auto Harmonic Screener - UltimateX [Trendoscope®] 🎲 Introduction to Auto Harmonic Screener UltimateX
The Auto Harmonic Screener UltimateX is a sophisticated TradingView indicator designed to automatically detect and screen for a wide range of harmonic patterns across multiple zigzag levels. It builds on the foundation of harmonic trading principles, using recursive zigzag analysis to identify potential reversal zones based on Fibonacci ratios. This indicator complements the Auto Harmonic Pattern UltimateX by focusing on screening functionality rather than isolated pattern detection. This is script is designed and optimized to be used with Pine Screener
The indicator produces harmonic patterns on the chart. As an indicator, it does not offer more than what Auto Harmonic Pattern UltimateX offers. However, the major difference is that Auto Harmonic Pattern UltimateX concentrates on the usage as indicator and providing stats and back test data based on historical patterns whereas this script is optimized to be used with Pine Screener to screen across 100s of symbols at once to find out potential patterns across the market.
🎲 Core Mechanics: How the Indicator Works
🎯 Zigzag Pivot Detection
The indicator starts by calculating zigzag pivots. Zigzag identifies swing highs and lows by filtering price movements based on a minimum length (default: 8 bars) and depth (default: 100 pivots).
You can opt to use close prices instead of high/low for zigzag calculation (via Use Close Prices ), which smooths out noise in volatile markets but may miss extreme swings.
Zigzag is recursive: It begins with a base level (level 0) and generates higher levels by combining pivots from lower levels. This allows scanning for patterns at various scales, from short-term to long-term structures.
New pivots trigger pattern scans only when confirmed
🎯 Harmonic Pattern Scanning
Patterns are scanned using the last 5 zigzag pivots: X (oldest), A, B, C, D (newest)
The scan compares price ratios (e.g., AB/XA, BC/AB, CD/BC, XD/XA) against predefined Fibonacci-based ranges for each pattern type, with an adjustable error threshold (default: 8%).
Log scale scanning (Scanning under Log Scale ) can be enabled for assets with exponential growth (e.g., cryptocurrencies), ensuring ratios are calculated proportionally.
Strict mode ( Strict Ratio Scanning Mode ) disables error additions when ratio ranges vary, prioritizing accuracy over quantity of detections.
Detected patterns are stored in an array and checked for duplicates (based on pivot indices) to avoid redundancy.
The Potential Reversal Zone (PRZ) is calculated as a range where the D point should land for pattern completion.
🎯 Pattern Categories and Types
Classic Patterns : Standard harmonic formations like Gartley, Bat, Butterfly, Crab, Deep Crab, Cypher, Shark, Nenstar,
Anti/Alternate Patterns : Variations with inverted or extended ratios, such as Anti Gartley, Anti Bat, Anti Butterfly, Anti Crab, Anti Cypher, Anti Shark, Anti Nenstar, Navarro.
Non-Standard Patterns : Less common structures like 5-0, Three Drives, or Black Swan, White Swan, 121, Sea Pony, Leonardo, Total.
You can enable/disable categories or individual patterns via inputs. The indicator uses a map to track active patterns and scans only those selected
🎯 Trade Monitoring and Confirmation
Patterns identified are monitored for entry, failure and success. Patterns are kept on the chart until they are either invalidated, stopped or reaches the target. The status of the pattern is also used during the filtering of patterns using Pine Screener
🎯 Output and Signals
The following plots are displayed in data window mode. These plots are used in Pine Screener for filtering symbols based on the presence of patterns.
Bullish (Awaiting Entry) : Plots 1 if there is a bullish pattern awaiting entry
Bullish (In Trade) : Plots 1 if there is a bullish pattern that has reached Entry and in trade.
Bearish (Awaiting Entry) : Plots 1 if there is a bearish pattern awaiting entry
Bearish (In Trade) : Plots 1 if there is a bearish pattern that has reached Entry and in trade.
🎲 Detailed Input Parameters
The indicator offers extensive customization through grouped inputs. Here's a breakdown:
🎯 Zigzag Parameters :
Use Close Prices (bool, default: false): Switches zigzag to use close prices for pivots, reducing sensitivity to wicks.
Length (int, default: 8, min: 3): Minimum bars between pivots; higher values filter more noise but may miss small patterns.
Depth (int, default: 100, max: 500): Maximum pivots stored; affects recursive zigzag levels and performance.
🎯 Generic Settings
Base (string, default: 'correction'): Determines the wave (impulse/correction) used for target projections. Options include 'min'/'max' for conservative/aggressive targets, or 'AD'/'CD' for specific legs.
Error Percent (int, default: 8, 0-20): Tolerance for ratio matches; lower = fewer but more accurate patterns.
Strict Ratio Scanning Mode (bool, default: false): Enforces exact ratios without error buffer for varying ranges.
Log Scale (two bools): Separate toggles for scanning patterns vs. projecting targets.
🎯 Trade Settings
Stop/Entry/Target (floats): Ratios for trade levels (stop=0.0 default, entry=0.3, target=0.618). Stop at 0.0 means no stop (use with caution); entry/target based on PRZ extension.
🎯 Display Settings
Draw (bool, default: true): Enables pattern drawings. When running in pine screener, this can be turned off
Theme (enum, default: DARK): Auto-generates colors (light/dark shades); or CUSTOM with 22 user-defined colors.
XABCD/Ratios (bools, default: true): Show/hide pivot labels and ratio annotations.
Label Size (string, default: small): Size for on-chart labels (tiny to huge).
🎲 Using with Pine Screener
Pine Screener is a powerful tradingview utility that allows users to build complex programmable screeners using Pinescript®. This script is designed in an optimized way in order to work with Pine Screener. Hence, the display of the indicator is limited. In order to use this script with pine screener, we need to follow these steps.
Prepare your watchlist
Pine screener works on a watchlist with less than 1000 symbols in them. We can use built-in tradingview screeners to perform initial screening based on broad categories. This can be as simple as filtering based on market cap. This initial filtering is only required if the number of symbols are more than 1000.
Load the watchlist and indicator to pine screener
Go to screener menu and load Pine Screener.
Once done, load the watchlist and indicator. Set filtering criteria, timeframe and indicator settings. And then press Scan to filter the symbols that match given criteria.
For more details, please watch the video published under the below idea.
Diverging Chart Patterns - Ultimate [Trendoscope®] 🎲 Presenting the Diverging Chart Patterns Ultimate Indicator
Much like its counterpart, the Converging Chart Patterns Ultimate indicator, this tool is an offshoot of our premium Auto Chart Patterns - Ultimate offering. However, it is exclusively designed to focus on diverging patterns.
🎲 Built on Extensive Research and Open-Source Foundations
Our journey toward creating this indicator has been guided by thorough research and insights gleaned from our previous works on Chart Patterns, which include:
Algorithmic Identification of Chart Patterns
Flag and Pennant Chart Patterns
Trading Diverging Chart Patterns
Drawing from the groundwork established by our publicly available indicators - Auto Chart Patterns and Flags and Pennants - this tool represents the culmination of our efforts to furnish traders with a refined approach to navigating diverging patterns. It not only facilitates the formulation of technical trading strategies but also aids in assessing their efficacy through historical performance analysis. The specific patterns addressed by this indicator encompass:
Rising Wedge (Diverging Type)
Falling Wedge (Diverging Type)
Diverging Triangle
Rising Triangle (Diverging Type)
Falling Triangle (Diverging Type)
🎲 Chart Pattern Scanning Methodology
Identifying diverging chart patterns follows a structured approach comprising several key steps:
Zigzag Examination : Start by analyzing each zigzag, focusing on the last 5 or 6 pivot points to pinpoint potential trend line pairs.
Divergence Verification : Project these trend lines backward and scrutinize for intersections within a specified number of bars prior. This step confirms the presence of divergence.
Pattern Categorization : Once divergence is confirmed, categorize each pattern based on the directional orientation of its trend lines. Refer to our article - Algorithmic Identification of Chart Patterns for detailed categorization guidelines.
🎲 Methodology or Trading for Chart Patterns
While traditional perspectives often prescribe specific trading biases to diverging patterns—for instance, labeling Rising Wedges as bearish and Falling Wedges as bullish, while acknowledging Triangles' versatility—there's limited empirical evidence to fully support these assumptions. Our indicator is crafted to empower users to explore and validate a wide range of trading hypotheses, including unconventional ones. This approach liberates trading strategies from being confined to historical market behaviors.
We offer extensive customization options to facilitate testing of diverse strategies. The initial setup accommodates both long and short trading scenarios for each identified pattern. Users retain the freedom to adjust trading directions and other parameters within the indicator's settings to align with their analytical preferences.
This open approach is grounded in the methodology detailed in - Trading Diverging Chart Patterns . It is exemplified by the following process, which users can customize and enhance using our indicator.
🎲 Insight into Indicator Components
The chart below provides an illustration of the components comprising our indicator:
Pattern Visualization : This functionality dynamically showcases patterns on the chart, emphasizing presently active ones. Historical patterns are omitted to uphold clarity and optimize performance, considering limitations in drawing object capacity.
Trading Annotations : The indicator conveniently denotes open trades directly on the chart, accommodating both long and short positions based on user preferences and the ongoing status of associated trades for each pattern.
Performance Metrics Table : A comprehensive table meticulously presents backtesting outcomes for individual patterns alongside aggregated results. It encompasses vital metrics such as win rates and the profit factor, calculated in alignment with the designated risk-reward ratio. These insights provide users with valuable assessments of potential profitability and trade strategy effectiveness.
🎲 Delving into the Indicator's Customization Features
Our indicator boasts a wealth of settings, empowering users to customize criteria and refine their trading strategies. Each setting comes with detailed tooltips, offering valuable insights into its functionality. Let's explore each category methodically.
🎯 Zigzag Configuration Options
These settings provide users with the flexibility to fine-tune their pattern analysis by adjusting the length and depth of the zigzag:
Length Adjustment : Altering this parameter modifies the scale of detected patterns. Higher values highlight larger formations, while lower ones focus on more compact patterns.
Depth Enhancement : This parameter adjusts the complexity of the recursive zigzag analysis, potentially revealing larger patterns across multiple levels. Users should exercise caution, as excessive depth may strain the indicator's processing capacity.
🎯 Pattern Scanning Settings
This collection of settings refines the pattern scanning process, typically adjusted to achieve precise geometric alignment of detected patterns. While many settings can be left at their default values for regular use, users are encouraged to customize them, particularly the "Last Pivot Direction," to explore different theoretical approaches to pattern trading.
🎯 Trade Configuration Settings
Arguably the most vital for users, these settings provide full control in shaping trading strategies based on diverging chart patterns. This encompasses the freedom to establish entry, stop, and target prices, fine-tune risk-reward ratios, choose historical depth for backtesting, and integrate filters to guide trade direction.
🎯 Pattern Specific Settings
Here, users have the flexibility to customize settings for individual patterns or groups, thereby refining the precision of their strategies. Alongside the option to enable/disable specific patterns and pattern groups, users can also choose pattern-specific settings such as Last Pivot Direction, Trade Direction Filter, and external filters.
🎯 Fully Customizable Alerts
Utilizing the alert() function, these notifications circumvent the usual template within the alert widget. To address this, we've integrated placeholders in the settings for creating comprehensive alert templates.
Available Categories Include
New - Alerts when a new pattern is identified
Entry - Alerts when an entry condition for a configured pattern based trade is met.
Stop - Alerts when a trade that has reached entry gets stopped out without reaching target
Target - Alerts when a trade reaches its target
Invalidation - Alerts when a trade reaches an invalidation point before reaching the entry.
Each alert type can possess its unique template. Tailorable templates are crucial for effectively utilizing alerts within broker or exchange integration.
Here are some of the placeholders that are defined in the indicator.
{type} - Alert type - new/entry/stop/target/invalid
{pid} - Pattern ID of the pattern belonging to trade. Multiple trades can have same pattern id since a pattern can be traded in both long and short directions.
{tid} - Unique Trade ID for the given trade.
{ticker} - Ticker ID on which the indicator is run
{timeframe} - Chart timeframe on which the indicator is run
{basecurrency} - Base currency of the symbol
{quotecurrency} - Quote currency of the symbol
{pivots} - Pivot values of the pattern
{price} - Current price when the alert is triggered.
{pattern} - Name of the pattern on which the alert is triggered.
{direction} - Direction of the trade.
{entrydirection} - Direction of the entry signal. Used for specific bot integration.
{exitdirection} - Direction of the exit signal. Used for specific bot integration.
{entry} - Entry price of the trade
{stop} - Stop price of the trade
{target} - Target price of the trade
{invalidation} - Invalidation price of the trade
🎯 Display and Stats
These settings regulate the display options on the chart. Closed trade statistics are showcased in a table and appear in the bottom-left corner of the chart. These can be tailored using the display settings.