Это пространство с платным контентом dgtrd. Теперь вы можете получить доступ к индикаторам пользователя напрямую на TradingView. Читайте подробнее о платном контенте MarketMastery Suite by DGT All-in-One Trading Framework for Price Action, Smart Money, and Market Structure
Unlock a complete, institutional-grade toolkit built for modern traders. The MarketMastery Suite blends advanced price action logic, multi-timeframe structure detection, capital flow analytics, and liquidation-based risk tools — empowering you to decode market behavior with confidence.
Whether you're identifying smart money zones, anticipating structural shifts, or managing position risk, MarketMastery Suite delivers actionable and adaptive insights.
KEY FEATURES
---------------------------------------------------------------------------------------------------------------
⯌ Dynamic Support & Resistance Zones
Automatically detects major Support and Resistance zones based on adaptive logic derived from ICT-style OBs and BBs. Rather than using fixed lookbacks, the script applies swing-based detection to reveal significant levels across Local, Regional, Global, and Macro structures — pinpointing areas of likely institutional interest.
⯌ Trend Stop & Range Detection
Tracks market bias with a smart 3-tier trailing stop that filters noise and identifies potential breakouts, traps, or directional flips — even in ranging conditions.
⯌ Fractal Market Structure & Shift Detection
Detects real-time Break of Structure (BoS) and Change of Character (CHoCH) events across fractal structure levels — Local to Macro — helping confirm or anticipate market shifts.
⯌ Volume & Capital Flow Analysis
Highlights volume spikes and overlays Cumulative Volume Delta (CVD) and Open Interest (OI) to uncover buyer/seller intent and momentum pressure shifts.
⯌ Trend Snapshot Dashboard
A clean, mobile-friendly dashboard that shows live trend strength, directional flow (Price, OI, CVD), and key capital activity, anchored to the latest swing evaluation window.
⯌ Liquidation Risk Zones
Visualizes liquidation and margin thresholds based on leverage, entry price, and maintenance margin — essential for futures risk planning.
ALERT MESSAGES
---------------------------------------------------------------------------------------------------------------
Support & Resistance Events
"Rejection {count} at Support · Support ≈ {value}"
"Support Retest {count} After Break · Support ≈ {value}"
"Rejection {count} at Resistance · Resistance ≈ {value}"
"Resistance Retest {count} After Break · Resistance ≈ {value}"
Support & Resistance Transitions
"Support Broken · {value} → Becomes Resistance"
"Resistance Broken · {value} → Becomes Support"
Market Structure Alerts
"{fractal depth} {Bullish|Bearish} Break of Structure detected."
"{fractal depth} {Bullish|Bearish} Change of Character detected."
Bias Transitions
"{Bullish|Bearish} Bias — Trailing stop flipped {upward|downward} {volume activity}"
"Potential {Bullish|Bearish} Flip — Early signs of {upward|downward} pressure {volume activity}"
"Ranging or Transitioning — Market lacks a clear trend {volume activity}"
Volume Spike
"Extreme volume spike detected!"
DISCLAIMER
---------------------------------------------------------------------------------------------------------------
This script is intended for informational and educational purposes only. It does not constitute financial, investment, or trading advice. All trading decisions made based on its output are solely the responsibility of the user. MarketMastery Pivot Matrix by DGT The MarketMastery Pivot Matrix is an advanced pivot point framework designed to provide comprehensive market context, bias assessment, and trend analysis. It integrates multiple pivot calculation methods, central pivot ranges, higher-timeframe references, and a suite of add-on indicators to deliver a complete market structure toolkit. Suitable for intraday, swing, and positional traders, the tool consolidates key support/resistance levels, equilibrium zones, directional flow, and volatility insights into a single, visually intuitive interface.
KEY FEATURES
⯌ Pivot Point Framework
The MarketMastery Pivot Matrix offers a complete solution for analyzing pivot points, price equilibrium, trend direction, and volatility. Supporting multiple pivot calculation methods—including Camarilla, Fibonacci, Swing, Traditional, and Woodie—it allows traders to customize analysis according to strategy and timeframe.
⯌ Central Pivot Range (CPR)
CPR is a core component of the Pivot Matrix, offering a clear view of market structure and key decision zones. Traditionally used for intraday analysis, CPR is equally effective on higher timeframes (daily, weekly, monthly), highlighting support/resistance, market balance, and swing opportunities. Integrated within the Pivot Matrix, it works seamlessly with other pivot components to provide a comprehensive trading framework across all timeframes.
⯌ Higher-Timeframe OHLC References
Displays previous session Open, High, Low, and Close from user-selected or dynamically calculated higher timeframes. Assists traders in assessing intraday support/resistance and session reactions.
⯌ Pivot High-Low Levels
Identifies key swing highs and lows as well as short-term potential pivot points. Highlights support/resistance zones, helping traders assess market structure, anticipate reversals, and spot trend continuation opportunities.
⯌ Directional Flow State
Combines ADX and DMI to provide clear insight into trend direction, strength, and momentum. Helps distinguish valid trending conditions from weak or ranging periods.
⯌ Mean Proximity State
Measures price deviation from equilibrium to classify balanced, extended, or extreme market states. Assists in evaluating potential reversion pressure and volatility expansion.
⯌ Logistic EMA Trend State (LEMA)
Applies a logistic transformation to price dynamics, smoothed by EMA for adaptive trend detection. Provides responsive trend visualization with reduced noise, helping identify trend direction and momentum.
⯌ Ichimoku Cloud Projection
Extends the Kumo cloud forward to visualize market bias, momentum, and dynamic support/resistance. Helps identify consolidation, trend direction, and equilibrium zones.
⯌ Linear Regression Channel
Fits a least-squares trend line to price, displaying slope and price dispersion. Helps traders identify trend direction, stability, and volatility.
⯌ Market Sentiment State
Evaluates market bias by analyzing price position relative to CPR and pivot levels. Provides a quick visual assessment of bullish, bearish, or neutral conditions.
⯌ Price Range & ATR State
Displays current and previous higher-timeframe ranges alongside ATR-based expected ranges. Helps assess volatility, monitor session expansion/contraction, and identify potential exhaustion zones.
DISCLAIMER
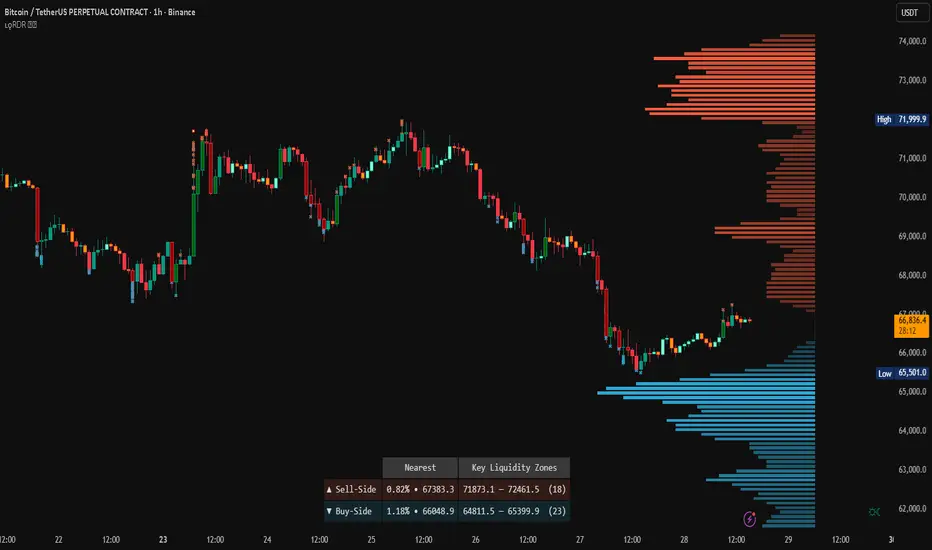
This script is intended for informational and educational purposes only. It does not constitute financial, investment, or trading advice. All trading decisions made based on its output are solely the responsibility of the user. Liquidity Radar by DGT Liquidity Radar is an advanced indicator designed to uncover and visualize critical liquidity zones on the price chart. These zones mark areas where stop orders and limit orders are densely concentrated—price levels where large-scale liquidation events are more likely to occur. Such areas are often targeted by institutional players to spark volatility or to optimize trade execution.
The indicator dynamically draws horizontal levels that reflect real-time liquidity buildup based on volume and price activity. When multiple liquidation levels cluster near the same price, overlapping lines highlight zones of elevated liquidity—helping traders identify potential hotspots for price reactions, reversals, or volatility spikes.
KEY FEATURES
⯌ Magnet Zones
Clusters of liquidation levels may act as magnets for price, pulling market movement toward them. Traders often use these zones to forecast directional bias and identify high-probability setups.
⯌ Support/Resistance Zones
Densely packed liquidity often behaves as dynamic support or resistance. These zones can provide major players with optimal entry or exit points, potentially leading to sharp reactions or market reversals.
⯌ Rapid Move Zones
Areas with sparse liquidity levels often experience faster price movement, as fewer resting orders are available to absorb aggressive taker orders. These zones can lead to quick price sweeps and momentum surges.
INSIGHTS
What Happens After Price Reaches a High Liquidity Zone?
Liquidity is "Grabbed"
These zones are typically filled with stop-losses or resting orders. When price reaches them, large volumes are executed — often suddenly. This is known as a liquidity grab or stop hunt .
Increased Volatility
The execution of clustered orders often triggers bursts of volatility. This can result in large wicks, rapid price movements, or deceptive “fakeouts” around the zone.
Price Reaction Scenarios
Stall or Consolidation : After liquidity is grabbed, price may pause or range, especially if market participants are indecisive.
Reversal : If the liquidity grab flushes out weak hands, price may reverse sharply — often where institutional players are already positioned in the opposite direction.
Continuation : Sometimes, the zone acts as a launchpad — price consumes the liquidity and continues strongly in the same direction.
What Happens When Price Is Between Liquidity Zones?
Faster Price Moves
In areas with fewer clustered liquidity levels, price often moves quicker due to fewer resting orders absorbing aggressive taker orders, enabling market orders to push price rapidly through these zones.
Higher Probability of Market (Taker) Orders
Sparse liquidity encourages taker orders, which “take” liquidity instantly, causing sharp and sometimes unpredictable price swings.
Reduced Support or Resistance
The lack of dense liquidity means fewer natural price barriers, allowing price to sweep through these zones with less friction until it nears the next liquidity cluster.
Increased Volatility and Potential Whipsaws
Rapid movement in low liquidity zones can trigger stop losses or cause fakeouts, resulting in sudden volatility and quick reversals.
Opportunity for Breakouts or Trend Acceleration
Price breaking from a liquidity zone into a sparse area may gain momentum quickly, leading to strong directional moves or trend continuation.
Liquidity zones aren’t just price targets — they’re high-stakes decision points. Once tapped, they often serve as temporary barriers where price may reverse, stall, or continue, depending on the prevailing order flow and participant intent. In leveraged markets, liquidations play a crucial role in shaping price behavior and positioning. The Liquidity Levels indicator helps traders spot where these impactful moments are most likely to occur — enhancing both strategic edge and decision-making confidence.
LIMITATIONS
Due to a technical limitation in Pine Script, a maximum of 500 horizontal levels can be drawn. As a result, some historical liquidity levels from earlier bars may not appear on the chart.
DISCLAIMER
This script is intended for informational and educational purposes only. It does not constitute financial, investment, or trading advice. All trading decisions made based on its output are solely the responsibility of the user. MarketMastery Structure Breaks & Projections by DGT MarketMastery Structure Breaks & Projections
MarketMastery Structure Breaks & Projections combines automated multi-tier structural detection with advanced projection analytics to provide actionable market insights.
This framework models continuation, maturity, pullbacks, and structural failures across Minor, Major, and Macro tiers, capturing market behavior at multiple layers simultaneously.
Powered by the proprietary Price Action Engine, the system detects validated structural breaks, derives adaptive support and resistance zones, measures displacement, and builds projection paths in real time.
All projections and structural zones are automatically derived from price behavior — no manual anchoring, parameter tuning, or sensitivity optimization required.
The result is a dynamic view of market intent that evolves with structure, helping traders see where price may continue, where reactions are likely, and when a structural thesis strengthens or weakens.
Although the tool is structurally sophisticated, extensive tooltips and contextual guidance are integrated throughout the interface, allowing traders at all experience levels to understand the logic and learn from the behavior being displayed.
⯌ Automatic Structural Authority
Markets operate across multiple structural layers simultaneously.
MarketMastery continuously evaluates Minor, Major, and Macro tiers, highlighting the structure currently exerting the strongest directional influence.
This ensures projections always reflect the most relevant tier and market context without user intervention.
⯌ Early Structure Context
Market behavior often develops before higher-tier structures fully confirm.
MarketMastery provides optional micro-structure context derived from short-range price behavior, offering early awareness of potential directional shifts while primary tier structures are still forming.
Traders can:
Anticipate developing continuation before confirmation
Identify early momentum transitions
Refine timing within larger structural bias
Detect weakening conditions sooner
Early context complements primary projections without overriding them, revealing emerging intent at lower structural resolution.
⯌ Projection Intelligence Dashboard
Real-time panel displaying the active structural tier, projection state, progress, and exposure metrics for rapid situational awareness.
The dashboard serves as the central interface for monitoring projection lifecycle development and structural risk conditions across Minor, Major, and Macro tiers. The dashboard reflects the current stage of the projection lifecycle in real time.
⯌ Projection Lifecycle Intelligence
Rather than displaying static targets, MarketMastery tracks the full lifecycle of structural movement across tiers:
Continuation Development
Emerging → Developing → Confirmed → Extended → Primary → Exhaustion
Structural Degradation
Pullback → Risk → Invalidated
This state engine provides objective awareness of:
Trend strengthening and maturation
Healthy pullbacks versus structural deterioration
Increasing failure probability
Full invalidation events
Traders gain contextual insight into how structure evolves rather than relying solely on price interpretation.
⯌ Progress & Exposure Metrics
The engine separates two critical dimensions of trade evaluation across tiers:
Progress — advancement from the break toward projected objectives
Exposure — vulnerability relative to origin and invalidation boundaries
These metrics are continuously updated within the dashboard, providing clear visibility into both opportunity and risk throughout the life of a structural move.
⯌ Alerts & Automation
MarketMastery includes an integrated alert system designed around structural events and projection state transitions.
Alerts can notify traders when:
New structural breaks occur
Projections reach confirmation or target milestones
Structural risk increases
Exhaustion conditions develop
Tier-specific events trigger across Minor, Major, or Macro structures
This allows the tool to function as a continuous structural monitoring system without requiring constant chart observation.
⯌ Dynamic Support & Resistance Zones
Zones are derived directly from confirmed structural pivots across tiers and remain active only while structurally valid, maintaining clean and relevant chart context.
⯌ Linear & Logarithmic Scale Compatibility
Projection calculations adapt to the selected chart scale to ensure accurate modeling across assets with different price ranges.
Who This Is For
Designed for traders who think in terms of structure, probability, and risk — not signals.
While the underlying engine is an institutional-grade analytical framework, the visual guidance and tooltips make it suitable both for experienced traders and for developing traders seeking to understand how market structure evolves.
Particularly valuable for:
Discretionary price action traders
Intraday and swing traders
Futures and crypto traders
Traders using multi-tier market structure or liquidity concepts
Systematic discretionary workflows
Philosophy
Markets move through structure.
Structure reveals intent.
Displacement creates opportunity.
MarketMastery does not predict the market.
It reveals what the market is already doing.
DISCLAIMER
This script is intended for informational and educational purposes only. It does not constitute financial, investment, or trading advice. All trading decisions made based on its output are solely the responsibility of the user.
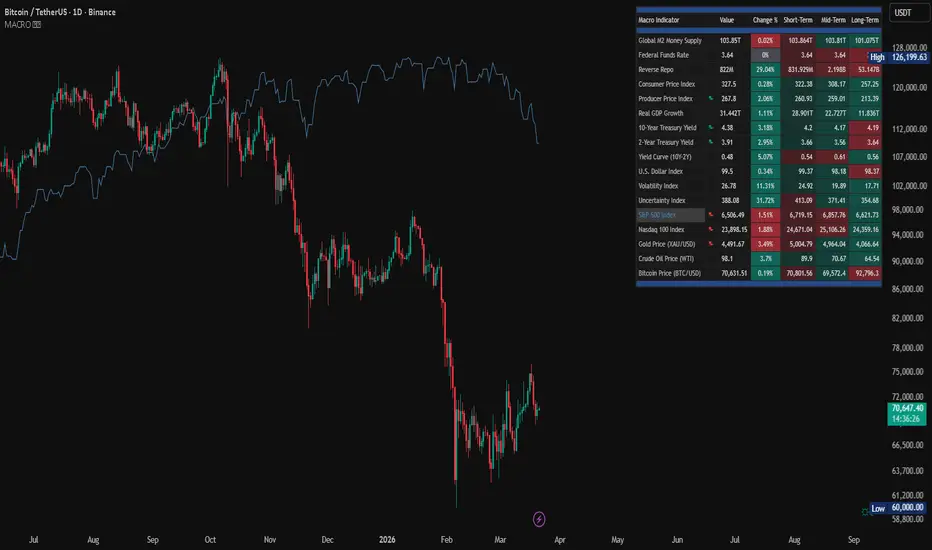
Macroeconomic Dashboard by DGT Macroeconomic Dashboard is a script tailored for traders and investors using top-down strategies to navigate global markets. It integrates key macroeconomic indicators, such as monetary policy, inflation, yields, and market sentiment, directly into financial charts.
By visualizing real-time macro data alongside asset price movements, this tool bridges the gap between traditional economic metrics and technical analysis. Whether analyzing crypto or traditional markets, users can better contextualize price action within broader economic cycles and trends.
Designed to support macro-informed decision-making, it helps identify shifts in liquidity, policy direction, and risk appetite, enhancing strategic trade entries and portfolio positioning.
KEY FEATURES
⯌ Macro Dashboard
The script provides a macro dashboard that tracks changes across key economic dimensions: monetary policy, inflation and growth, bond markets, and risk indicators. With built-in anomaly detection and trend analysis across short-, mid-, and long-term timeframes, it helps interpret market moves through a macroeconomic lens, whether analyzing equities, commodities, or digital assets.
⯌ Macro on Chart
By visualizing macro data such as M2 money supply, CPI, treasury yields, and volatility indices, users can more easily correlate economic developments with price action, enhancing situational awareness and decision-making.
MACRO METRICS
The script covers five core macroeconomic domains, each with key metrics:
Liquidity & Monetary Policy
Global M2 Money Supply
Federal Funds Rate
Reverse Repo Operations
Inflation & Economic Growth
Consumer Price Index (CPI)
Producer Price Index (PPI)
Real GDP Growth
Yields & Bond Markets
10-Year Treasury Yield
2-Year Treasury Yield
Yield Curve (10Y–2Y Spread)
Global Risk & Currency Indicators
U.S. Dollar Index (DXY)
Volatility Index (VIX)
Economic Policy Uncertainty Index
Equities, Commodities & Crypto
S&P 500 (SPX)
Nasdaq 100 (NDX)
Gold (XAU/USD)
Crude Oil (WTI)
Bitcoin (BTCUSD)
DISCLAIMER
This script is intended for informational and educational purposes only. It does not constitute financial, investment, or trading advice. All trading decisions made based on its output are solely the responsibility of the user. MarketMastery VWAP Framework by DGT The MarketMastery VWAP Framework is a professional-grade valuation system designed to map fair value, directional bias, and market participation across all trading horizons.
At its core is the Price Action Engine, a proprietary, price-only structure model that dynamically identifies swing highs and lows across Local, Regional, Global, and Macro levels. This allows VWAPs to anchor directly to true market structure, rather than relying solely on fixed session or time-based resets.
By unifying session-based, time-based, range-based, user-defined, and structure-anchored VWAPs, the framework delivers a complete, adaptive valuation layer that evolves with price and volume in real time.
Built for intraday, swing, and positional traders, it transforms VWAP from a static reference into a context-aware decision tool, clearly highlighting acceptance, rejection, and value migration.
KEY FEATURES
⯌ Swing-Anchored VWAPs (Structure-Based)
Automatically anchors VWAPs to confirmed swing highs and lows detected by the Price Action Engine.
These VWAPs track how value develops after structural shifts and remain active until volatility-adjusted acceptance invalidates them, making them ideal for trend legs, re-accumulation, and distribution phases.
⯌ User-Defined Anchor VWAP
Manually anchor VWAP to any bar on the chart for discretionary analysis.
This mode uniquely supports the Advanced VWAP Deviation Engine, offering symmetric, asymmetric, and hybrid deviation bands to assess imbalance, absorption, and volatility expansion around key reference points.
⯌ Session-Anchored VWAPs
Anchors VWAP to the official open of major trading sessions:
Asia (Tokyo), Frankfurt, London, New York, and NYSE Cash (RTH).
Useful for identifying session bias, institutional participation, and cross-session acceptance.
⯌ Time-Anchored VWAPs
Resets VWAP at Day, Week, Month, and Quarter opens, providing higher-timeframe context and alignment for swing and positional trades.
⯌ Range-Anchored VWAPs (Price Extremes)
Anchors VWAP to price extremes instead of time.
Automatically resets on new Highs or Lows for selected ranges (Day, RTH, Week, Month), highlighting reactions at statistically important boundaries.
⯌ Multi-Context Valuation Framework
Layer multiple VWAP types intentionally to build a clear valuation map, showing where value formed, who participated, and whether price is accepting or rejecting that value.
Who This Is For
✔ Traders who use VWAP professionally, not casually
✔ Intraday, swing, and positional traders
✔ Traders focused on market structure, acceptance, and participation
✔ Users who want context, not clutter
Important Notes
Structure detection is 100% price-based (no indicators, no fixed lookbacks)
VWAP behavior adapts to price, volume, and volatility
Designed for clarity and decision-making, not signal spam
DISCLAIMER
This script is intended for informational and educational purposes only.
It does not constitute financial, investment, or trading advice.
All trading decisions made based on its output are solely the responsibility of the user.