
2380 Technical Analysis: Weekly Bullish Breakout in Play
2380 (Rabigh Refining & Petrochemical Co.)
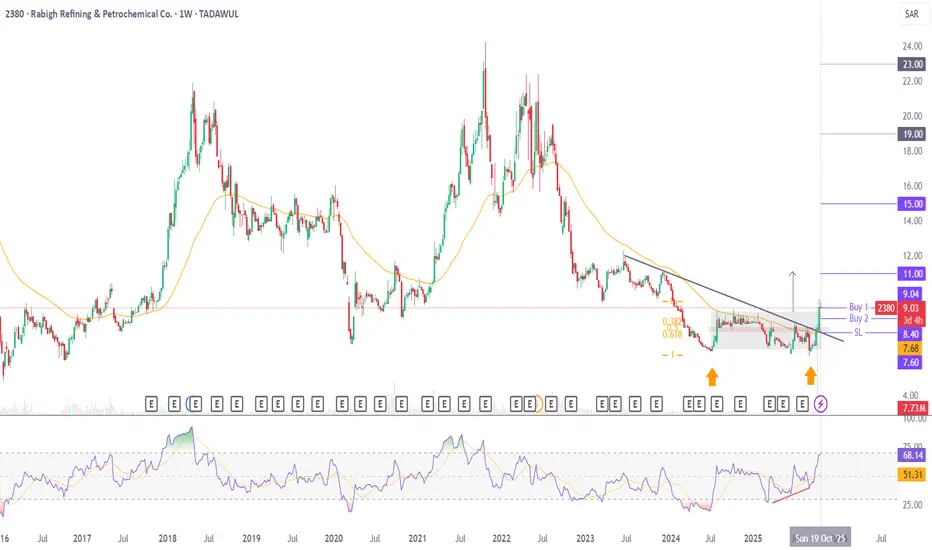
Price has broken out of a bullish rectangle pattern on the weekly timeframe, supported by bullish divergence and strong volume. On the monthly chart, it has formed a double bottom and hidden bullish divergence, while continuing to move within a long-term range between 26 and 6 since 2009.
Price is trading above the 55 Fibonacci EMA on the weekly chart — a level it has historically respected as dynamic support and resistance. It has also given a breakout from the daily trendline, further strengthening the bullish structure.
Buy 2 is positioned lower in case of a healthy pullback for a stronger average. TP1 aligns with the rectangle projection, while sustained momentum could open room for price to extend toward 15, 19 and 23.
Recommended Levels:
Financially, the stock isn’t too strong — only free cash flow from operating activities and overall FCF remain positive on a quarterly basis.
Potential remains strong technically as long as price sustains above the 55 EMA. Happy trading!
Price has broken out of a bullish rectangle pattern on the weekly timeframe, supported by bullish divergence and strong volume. On the monthly chart, it has formed a double bottom and hidden bullish divergence, while continuing to move within a long-term range between 26 and 6 since 2009.
Price is trading above the 55 Fibonacci EMA on the weekly chart — a level it has historically respected as dynamic support and resistance. It has also given a breakout from the daily trendline, further strengthening the bullish structure.
Buy 2 is positioned lower in case of a healthy pullback for a stronger average. TP1 aligns with the rectangle projection, while sustained momentum could open room for price to extend toward 15, 19 and 23.
Recommended Levels:
- Buy 1: 9.04 (CMP)
- Buy 2: 8.40
- Stop Loss: Closing below 7.60
- Take Profit 1: 11.00
- Take Profit 2: 15.00
- Take Profit 3: Ride the trend with a trailing stop
Financially, the stock isn’t too strong — only free cash flow from operating activities and overall FCF remain positive on a quarterly basis.
Potential remains strong technically as long as price sustains above the 55 EMA. Happy trading!

คำจำกัดสิทธิ์ความรับผิดชอบ
ข้อมูลและบทความไม่ได้มีวัตถุประสงค์เพื่อก่อให้เกิดกิจกรรมทางการเงิน, การลงทุน, การซื้อขาย, ข้อเสนอแนะ หรือคำแนะนำประเภทอื่น ๆ ที่ให้หรือรับรองโดย TradingView อ่านเพิ่มเติมใน ข้อกำหนดการใช้งาน
คำจำกัดสิทธิ์ความรับผิดชอบ
ข้อมูลและบทความไม่ได้มีวัตถุประสงค์เพื่อก่อให้เกิดกิจกรรมทางการเงิน, การลงทุน, การซื้อขาย, ข้อเสนอแนะ หรือคำแนะนำประเภทอื่น ๆ ที่ให้หรือรับรองโดย TradingView อ่านเพิ่มเติมใน ข้อกำหนดการใช้งาน