
🐳 BIGBELUGA TRADING ROADMAP
Course 01 — Classical Technical Analysis · Lesson 5
Single Candle Patterns: The Smallest Signals on the Chart
Difficulty: 🐳🐋🐋🐋🐋 (Beginner)
One candle can flip the entire story of a chart. The Doji, Hammer, Shooting Star, and Marubozu are not random shapes — they are footprints of the battle between buyers and sellers, captured in a single bar. Reading them correctly is what separates traders who see signals from traders who see noise.

🔵 RECAP — WHERE WE LEFT OFF
In Lesson 4, you learned how to draw, trade, and break out of channels. Channels gave you the structure. Now we zoom in to the smallest unit on the chart: one single candle. Because the moment a channel boundary or S/R level holds, it is usually a single candle that tells you.
🔵 WHY ONE CANDLE MATTERS
Inside every candle is a story:
When a meaningful single-candle pattern forms at a key location, it is often the final confirmation before a move begins.
🐳 Pro Tip: A pattern in the middle of nowhere is noise. The same pattern at a strong S/R level is a signal.
🔵 1. THE DOJI FAMILY — INDECISION CANDLES
A Doji is a candle where open and close are nearly identical. The body is tiny or non-existent. It signals indecision.

Four Doji variations:
🐳 Pro Tip: A Doji on its own means nothing. A Doji at a Daily resistance, after an extended rally? That is a serious warning.
🔵 2. THE HAMMER FAMILY — REJECTION CANDLES
These candles have a small body and one long wick. They mark the moment one side rejected an extreme.

Four rejection patterns:
🐳 Pro Tip: The shape is meaningless without context. A Hammer at the bottom of a downtrend is bullish. The exact same shape at the top of an uptrend is the bearish Hanging Man. Location decides the meaning.
🔵 3. MARUBOZU — POWER CANDLES
A Marubozu has a large body with little to no wicks. Open and close are at the extremes of the candle's range.

🐳 Pro Tip: Marubozu candles after a breakout = trend confirmation. Marubozu candles after a long rally with declining volume = exhaustion.
🔵 4. SPINNING TOPS — WEAK INDECISION
Spinning tops have a small body in the middle with wicks of similar length on both sides. Like a Doji, but with a visible body.
They signal indecision — not as strong as a Doji, but a slowdown in momentum. When you see clusters of spinning tops, expect a change in direction.
🔵 5. HOW TO READ ANY SINGLE CANDLE PATTERN
A single candle pattern is never a signal by itself. To be valid it needs:

Example workflow: Daily downtrend → price reaches a strong support → Hammer forms → next candle closes bullish → enter long. That is a 4-factor confirmation, not a single-candle gamble.
🔵 6. COMMON BEGINNER MISTAKES
🔵 7. YOUR SINGLE-CANDLE FRAMEWORK
Before reacting to any single-candle pattern, ask:
🔵 QUICK SELF-CHECK
🔵 WHAT IS NEXT
Lesson 6 — Multi-Candle Patterns: one candle tells a sentence. Two or three candles together tell a paragraph. We will cover Engulfing patterns, Morning/Evening Stars, Three Soldiers/Crows, and how combined patterns deliver stronger signals than any single candle ever could.
Drop a comment: which single-candle pattern do you trust the most — Hammer, Engulfing, or something else?
Full Trading Roadmap | Classical TA Course
Trading Roadmap | Classical TA · Lesson 01 — Mastering the Chart
Trading Roadmap | Classical TA · Lesson 02 — Mastering Trends
Trading Roadmap | Classical TA · Lesson 03 — Support & Resistance
Trading Roadmap | Classical TA · Lesson 04 — Price Channels
Best Regards, BigBeluga 🐳
Course 01 — Classical Technical Analysis · Lesson 5
Single Candle Patterns: The Smallest Signals on the Chart
Difficulty: 🐳🐋🐋🐋🐋 (Beginner)
One candle can flip the entire story of a chart. The Doji, Hammer, Shooting Star, and Marubozu are not random shapes — they are footprints of the battle between buyers and sellers, captured in a single bar. Reading them correctly is what separates traders who see signals from traders who see noise.
🔵 RECAP — WHERE WE LEFT OFF
In Lesson 4, you learned how to draw, trade, and break out of channels. Channels gave you the structure. Now we zoom in to the smallest unit on the chart: one single candle. Because the moment a channel boundary or S/R level holds, it is usually a single candle that tells you.
🔵 WHY ONE CANDLE MATTERS
Inside every candle is a story:
- Who fought (buyers vs sellers)
- Who won (close vs open)
- How decisively (body size)
- Who tried but failed (the wicks)
When a meaningful single-candle pattern forms at a key location, it is often the final confirmation before a move begins.
🐳 Pro Tip: A pattern in the middle of nowhere is noise. The same pattern at a strong S/R level is a signal.
🔵 1. THE DOJI FAMILY — INDECISION CANDLES
A Doji is a candle where open and close are nearly identical. The body is tiny or non-existent. It signals indecision.
Four Doji variations:
- Standard Doji — small body, wicks on both sides roughly equal. Pure indecision.
- Long-Legged Doji — very long wicks on both sides. Heightened volatility with no winner.
- Gravestone Doji — long upper wick, no lower wick. Buyers pushed up, sellers crushed them back. Bearish at resistance.
- Dragonfly Doji — long lower wick, no upper wick. Sellers pushed down, buyers absorbed them. Bullish at support.
🐳 Pro Tip: A Doji on its own means nothing. A Doji at a Daily resistance, after an extended rally? That is a serious warning.
🔵 2. THE HAMMER FAMILY — REJECTION CANDLES
These candles have a small body and one long wick. They mark the moment one side rejected an extreme.
Four rejection patterns:
- Hammer — small body at the top, long lower wick. Appears at the bottom of a downtrend = potential bullish reversal.
- Inverted Hammer — small body at the bottom, long upper wick. Appears at the bottom of a downtrend = potential bullish reversal (less common, needs confirmation).
- Hanging Man — looks identical to a Hammer, but appears at the top of an uptrend = potential bearish reversal.
- Shooting Star — looks identical to Inverted Hammer, but appears at the top of an uptrend = potential bearish reversal.
🐳 Pro Tip: The shape is meaningless without context. A Hammer at the bottom of a downtrend is bullish. The exact same shape at the top of an uptrend is the bearish Hanging Man. Location decides the meaning.
🔵 3. MARUBOZU — POWER CANDLES
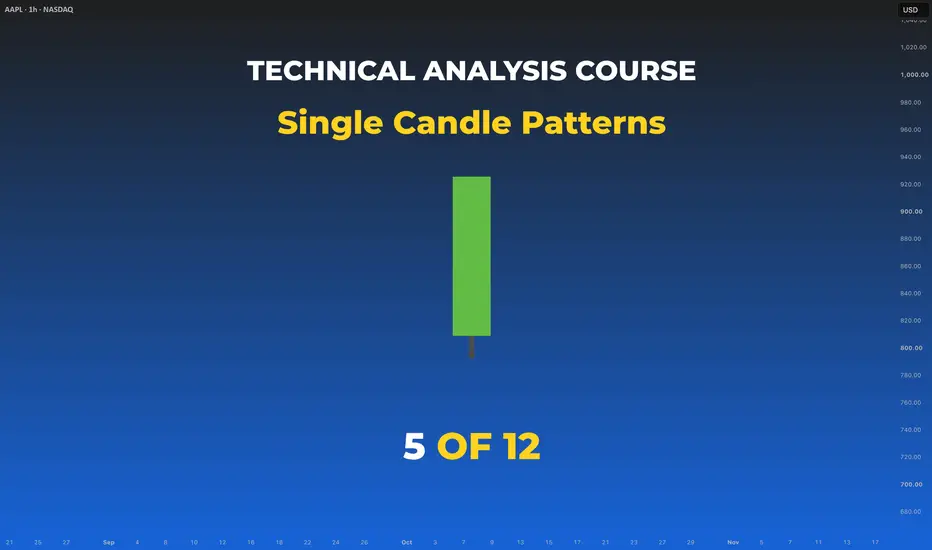
A Marubozu has a large body with little to no wicks. Open and close are at the extremes of the candle's range.
- Bullish Marubozu — long green body, no wicks. Buyers dominated start to finish. Strong continuation signal.
- Bearish Marubozu — long red body, no wicks. Sellers dominated start to finish. Strong continuation signal.
🐳 Pro Tip: Marubozu candles after a breakout = trend confirmation. Marubozu candles after a long rally with declining volume = exhaustion.
🔵 4. SPINNING TOPS — WEAK INDECISION
Spinning tops have a small body in the middle with wicks of similar length on both sides. Like a Doji, but with a visible body.
They signal indecision — not as strong as a Doji, but a slowdown in momentum. When you see clusters of spinning tops, expect a change in direction.
🔵 5. HOW TO READ ANY SINGLE CANDLE PATTERN
A single candle pattern is never a signal by itself. To be valid it needs:
- Location — at a key S/R level, channel boundary, or trendline
- Trend context — reversal patterns need a prior trend to reverse
- Confirmation — usually the next candle in the new direction
- Higher-timeframe alignment — the bias of the higher TF should agree
Example workflow: Daily downtrend → price reaches a strong support → Hammer forms → next candle closes bullish → enter long. That is a 4-factor confirmation, not a single-candle gamble.
🔵 6. COMMON BEGINNER MISTAKES
- Trading a single candle without location context
- Treating a Hammer as guaranteed reversal
- Confusing a Hammer with a Hanging Man (same shape, different location)
- Entering on the pattern itself without waiting for confirmation
- Using single candles on low timeframes (5m) without HTF alignment
- Ignoring the wick-to-body ratio when classifying
🔵 7. YOUR SINGLE-CANDLE FRAMEWORK
Before reacting to any single-candle pattern, ask:
- Where is this candle on the chart? (Random spot? Or at a level?)
- What is the prior trend? (Does the pattern make sense in this context?)
- Did the next candle confirm the signal?
- Is the higher-timeframe in alignment?
🔵 QUICK SELF-CHECK
- Identify all four Doji types in under 5 seconds
- Tell a Hammer from a Hanging Man by location
- Recognize a Marubozu and explain what it signals
- Know when a single candle is a signal vs noise
- Run the 4-step framework before taking a single-candle trade
🔵 WHAT IS NEXT
Lesson 6 — Multi-Candle Patterns: one candle tells a sentence. Two or three candles together tell a paragraph. We will cover Engulfing patterns, Morning/Evening Stars, Three Soldiers/Crows, and how combined patterns deliver stronger signals than any single candle ever could.
Drop a comment: which single-candle pattern do you trust the most — Hammer, Engulfing, or something else?
Full Trading Roadmap | Classical TA Course
Trading Roadmap | Classical TA · Lesson 01 — Mastering the Chart
Trading Roadmap | Classical TA · Lesson 02 — Mastering Trends
Trading Roadmap | Classical TA · Lesson 03 — Support & Resistance
Trading Roadmap | Classical TA · Lesson 04 — Price Channels
Best Regards, BigBeluga 🐳

🌐 bigbeluga.org/tv - Get access to our powerful tools & indicators.
🔵 Learn More -> docs.bigbeluga.org/
🔵 Join Discord -> go.bigbeluga.org/k65q9bfqfu
All content provided by BigBeluga is for educational purposes only
🔵 Learn More -> docs.bigbeluga.org/
🔵 Join Discord -> go.bigbeluga.org/k65q9bfqfu
All content provided by BigBeluga is for educational purposes only
คำจำกัดสิทธิ์ความรับผิดชอบ
ข้อมูลและบทความไม่ได้มีวัตถุประสงค์เพื่อก่อให้เกิดกิจกรรมทางการเงิน, การลงทุน, การซื้อขาย, ข้อเสนอแนะ หรือคำแนะนำประเภทอื่น ๆ ที่ให้หรือรับรองโดย TradingView อ่านเพิ่มเติมใน ข้อกำหนดการใช้งาน