Analyse
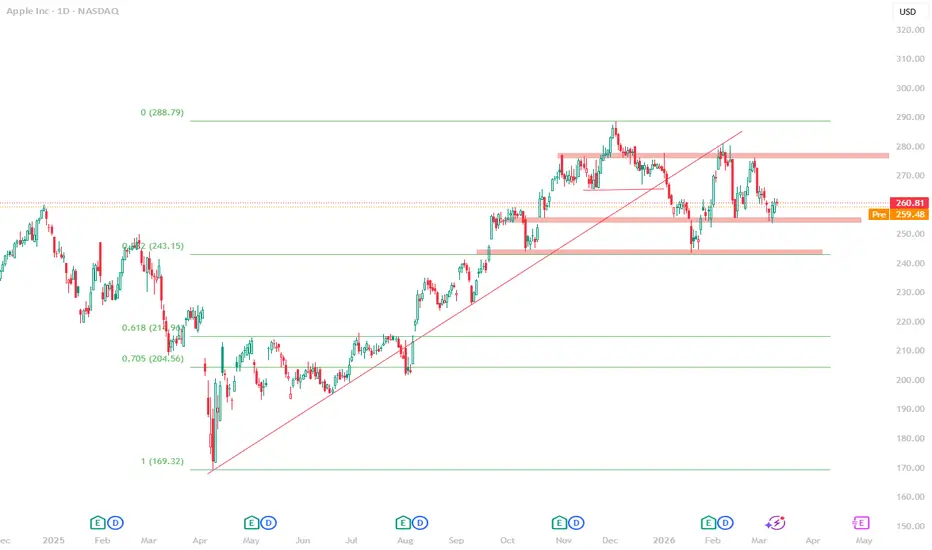
 AAPL Apple is currently trading inside a clear consolidation range after a strong bullish trend.
The market structure is interesting because price recently broke the ascending trendline, and now it is reacting between two major levels.
Key levels I'm watching:
280 – 285 area
252 – 255 area
As long as price remains inside this range, the market is in compression mode, which often precedes a strong move.
Bullish scenario
If AAPL breaks and holds above the 280 resistance, the next potential target could be around 300+.
Bearish scenario
If price loses the support around 252, we could see a deeper retracement toward 243 which aligns with the 0.382 Fibonacci level.
Right now, this looks like a classic range accumulation after a strong trend.
Interesting observation
One thing I noticed while studying this chart is how similar the structure looks to XOM XOM (Exxon Mobil) recently.
Both charts show
Because of that, I'm also watching XOM on Bitget stock futures, since they allow trading these stocks with leverage and even outside regular market hours.
Sometimes when two assets show similar structures, they can present comparable trading opportunities.
Do you thinkAAPL breaks above the range or rejects again?
And are you currently watching any energy stocks like XOM?
AAPL Apple is currently trading inside a clear consolidation range after a strong bullish trend.The market structure is interesting because price recently broke the ascending trendline, and now it is reacting between two major levels.
Key levels I'm watching:
280 – 285 area
252 – 255 area
As long as price remains inside this range, the market is in compression mode, which often precedes a strong move.
Bullish scenario
If AAPL breaks and holds above the 280 resistance, the next potential target could be around 300+.
Bearish scenario
If price loses the support around 252, we could see a deeper retracement toward 243 which aligns with the 0.382 Fibonacci level.
Right now, this looks like a classic range accumulation after a strong trend.
Interesting observation
One thing I noticed while studying this chart is how similar the structure looks to
XOM XOM (Exxon Mobil) recently.Both charts show
- strong bullish impulse
- consolidation near highs
- clear horizontal range
Because of that, I'm also watching XOM on Bitget stock futures, since they allow trading these stocks with leverage and even outside regular market hours.
Sometimes when two assets show similar structures, they can present comparable trading opportunities.
Do you think
AAPL breaks above the range or rejects again?And are you currently watching any energy stocks like XOM?

คำจำกัดสิทธิ์ความรับผิดชอบ
ข้อมูลและบทความไม่ได้มีวัตถุประสงค์เพื่อก่อให้เกิดกิจกรรมทางการเงิน, การลงทุน, การซื้อขาย, ข้อเสนอแนะ หรือคำแนะนำประเภทอื่น ๆ ที่ให้หรือรับรองโดย TradingView อ่านเพิ่มเติมใน ข้อกำหนดการใช้งาน
คำจำกัดสิทธิ์ความรับผิดชอบ
ข้อมูลและบทความไม่ได้มีวัตถุประสงค์เพื่อก่อให้เกิดกิจกรรมทางการเงิน, การลงทุน, การซื้อขาย, ข้อเสนอแนะ หรือคำแนะนำประเภทอื่น ๆ ที่ให้หรือรับรองโดย TradingView อ่านเพิ่มเติมใน ข้อกำหนดการใช้งาน