
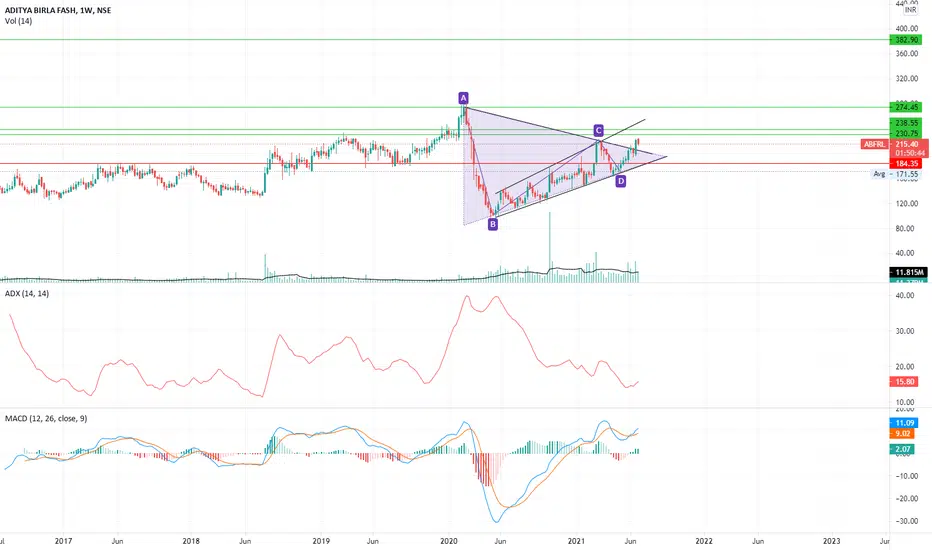
A Symmetric Triangle formation has occurred on the weekly charts.
Above average high volume on breakout.
Also price has been in an expanding formation since 11th May 2020.
Price objective as per Triangle formation comes to 382.9
Other near term price targets are shown by green horizontal lines
Rising ADX line + Bullish MACD crossover on weekly charts further confirm the bullish trend
Stop Loss can be kept at 184.3
Risk/Reward Ratio is 4.35
Above average high volume on breakout.
Also price has been in an expanding formation since 11th May 2020.
Price objective as per Triangle formation comes to 382.9
Other near term price targets are shown by green horizontal lines
Rising ADX line + Bullish MACD crossover on weekly charts further confirm the bullish trend
Stop Loss can be kept at 184.3
Risk/Reward Ratio is 4.35

คำจำกัดสิทธิ์ความรับผิดชอบ
ข้อมูลและบทความไม่ได้มีวัตถุประสงค์เพื่อก่อให้เกิดกิจกรรมทางการเงิน, การลงทุน, การซื้อขาย, ข้อเสนอแนะ หรือคำแนะนำประเภทอื่น ๆ ที่ให้หรือรับรองโดย TradingView อ่านเพิ่มเติมใน ข้อกำหนดการใช้งาน
คำจำกัดสิทธิ์ความรับผิดชอบ
ข้อมูลและบทความไม่ได้มีวัตถุประสงค์เพื่อก่อให้เกิดกิจกรรมทางการเงิน, การลงทุน, การซื้อขาย, ข้อเสนอแนะ หรือคำแนะนำประเภทอื่น ๆ ที่ให้หรือรับรองโดย TradingView อ่านเพิ่มเติมใน ข้อกำหนดการใช้งาน