
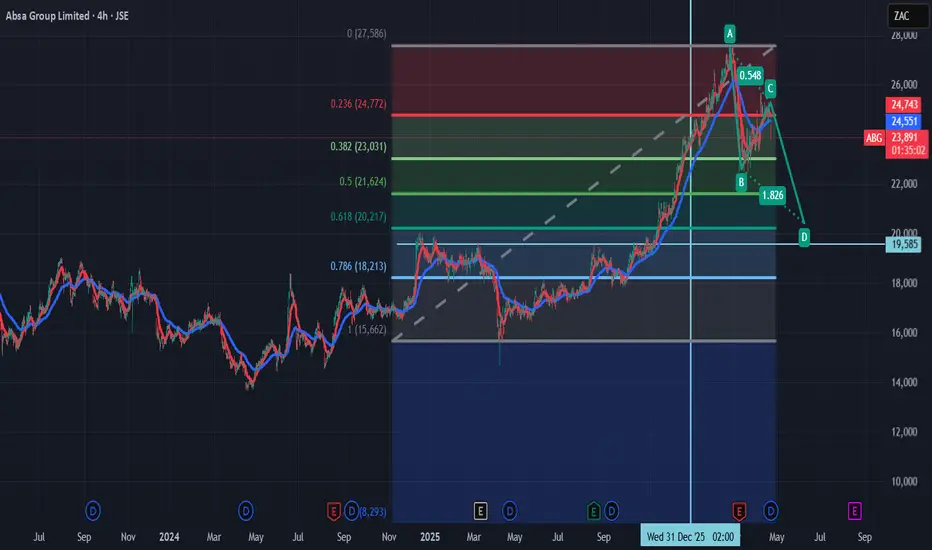
The stock is currently showing signs of exhaustion after a sustained run, moving into a corrective AB=CD structure. Technically, this bearish harmonic pattern suggests a natural "cooling off" period is overdue. We are looking for price to gravitate toward the 50% to 61.8% Fibonacci retracement zone, which represents a critical area for seasonal loading and trend re-evaluation.
Fundamentally, this retracement is being driven by a "triple threat" of local and global factors. The recent oil tanker fires have sent energy prices soaring, pushing domestic inflation high. This has forced the SARB to pivot from a cutting cycle to potentially anticipating rate hikes, which historically triggers a rise in banking sector defaults. Combined with the uncertainty of the upcoming 2026 municipal elections, these headwinds are creating a perfect environment for institutional profit-taking, making the 50–61% zone the primary target for the next impulsive leg.
Fundamentally, this retracement is being driven by a "triple threat" of local and global factors. The recent oil tanker fires have sent energy prices soaring, pushing domestic inflation high. This has forced the SARB to pivot from a cutting cycle to potentially anticipating rate hikes, which historically triggers a rise in banking sector defaults. Combined with the uncertainty of the upcoming 2026 municipal elections, these headwinds are creating a perfect environment for institutional profit-taking, making the 50–61% zone the primary target for the next impulsive leg.
การซื้อขายยังคงดำเนินอยู่
The stock is currently trading around 22,761, down roughly 5.3% today as it tests that critical lower boundarปิดการเทรด: ถึงเป้าหมายการทำกำไร
This is for educational and research purposes only and does not constitute investment advice.
คำจำกัดสิทธิ์ความรับผิดชอบ
ข้อมูลและบทความไม่ได้มีวัตถุประสงค์เพื่อก่อให้เกิดกิจกรรมทางการเงิน, การลงทุน, การซื้อขาย, ข้อเสนอแนะ หรือคำแนะนำประเภทอื่น ๆ ที่ให้หรือรับรองโดย TradingView อ่านเพิ่มเติมใน ข้อกำหนดการใช้งาน
คำจำกัดสิทธิ์ความรับผิดชอบ
ข้อมูลและบทความไม่ได้มีวัตถุประสงค์เพื่อก่อให้เกิดกิจกรรมทางการเงิน, การลงทุน, การซื้อขาย, ข้อเสนอแนะ หรือคำแนะนำประเภทอื่น ๆ ที่ให้หรือรับรองโดย TradingView อ่านเพิ่มเติมใน ข้อกำหนดการใช้งาน