
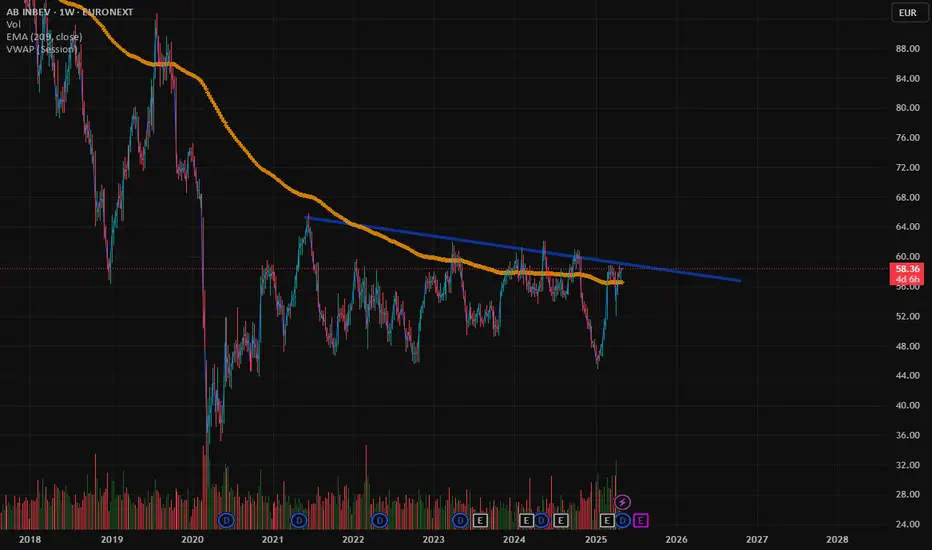
ABI Showing Bullish Signs Above EMA 200 – Potential Breakout Ahead
Anheuser-Busch InBev (ABI) experienced a significant drop in 2021, marked by a large-volume bearish candle. Since then, the stock has been gradually recovering and is now trading above the EMA 200, indicating a potential shift in trend.
Key observations:
Price above EMA 209: Suggests a bullish long-term trend.
Gradual recovery: Indicates steady accumulation.
Potential breakout: A move above recent resistance levels could confirm a bullish breakout.
Monitoring for a sustained move above resistance with increased volume could provide a strong bullish signal.
Not financial advice – just my technical analysis.
#ABI #AnheuserBusch #StockAnalysis #EMA200 #BullishTrend #TechnicalAnalysis #TradingView
Anheuser-Busch InBev (ABI) experienced a significant drop in 2021, marked by a large-volume bearish candle. Since then, the stock has been gradually recovering and is now trading above the EMA 200, indicating a potential shift in trend.
Key observations:
Price above EMA 209: Suggests a bullish long-term trend.
Gradual recovery: Indicates steady accumulation.
Potential breakout: A move above recent resistance levels could confirm a bullish breakout.
Monitoring for a sustained move above resistance with increased volume could provide a strong bullish signal.
Not financial advice – just my technical analysis.
#ABI #AnheuserBusch #StockAnalysis #EMA200 #BullishTrend #TechnicalAnalysis #TradingView

คำจำกัดสิทธิ์ความรับผิดชอบ
ข้อมูลและบทความไม่ได้มีวัตถุประสงค์เพื่อก่อให้เกิดกิจกรรมทางการเงิน, การลงทุน, การซื้อขาย, ข้อเสนอแนะ หรือคำแนะนำประเภทอื่น ๆ ที่ให้หรือรับรองโดย TradingView อ่านเพิ่มเติมใน ข้อกำหนดการใช้งาน
คำจำกัดสิทธิ์ความรับผิดชอบ
ข้อมูลและบทความไม่ได้มีวัตถุประสงค์เพื่อก่อให้เกิดกิจกรรมทางการเงิน, การลงทุน, การซื้อขาย, ข้อเสนอแนะ หรือคำแนะนำประเภทอื่น ๆ ที่ให้หรือรับรองโดย TradingView อ่านเพิ่มเติมใน ข้อกำหนดการใช้งาน