
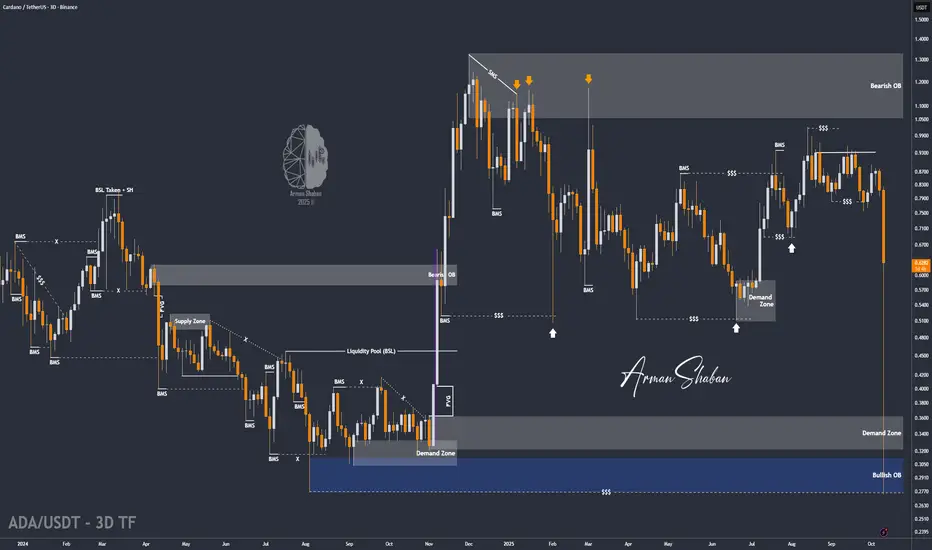
By analyzing the Cardano (ADA) chart on the 3-day timeframe, we can see that, like the rest of the market — or even more severely — ADA faced a massive dump of over 65%, dropping below $0.275.
After a liquidity grab under that level, strong buying pressure emerged, driving the price up by 130%, reaching around $0.63. However, ADA still needs to rise about 30% more just to return to the level where this drop originally began.
This cryptocurrency remains highly promising, and if Bitcoin stabilizes above $110,000, we could expect the next bullish wave to begin for Cardano.
Please support me with your likes and comments to motivate me to share more analysis with you and share your opinion about the possible trend of this chart with me !
Best Regards , Arman Shaban
After a liquidity grab under that level, strong buying pressure emerged, driving the price up by 130%, reaching around $0.63. However, ADA still needs to rise about 30% more just to return to the level where this drop originally began.
This cryptocurrency remains highly promising, and if Bitcoin stabilizes above $110,000, we could expect the next bullish wave to begin for Cardano.
Please support me with your likes and comments to motivate me to share more analysis with you and share your opinion about the possible trend of this chart with me !
Best Regards , Arman Shaban
การซื้อขายยังคงดำเนินอยู่
By analyzing the #Cardano (ADA) chart on the 3-day timeframe, we can see that ADA has continued its impressive rebound — climbing from around $0.63 to $0.70, marking an additional 11% gain since the last update and confirming sustained bullish momentum.This move reinforces the strength of the $0.60–$0.63 demand zone, which continues to attract institutional buying interest. The structure remains bullish, and as long as ADA holds above $0.63, the next upside targets are $0.75, $0.85, and $0.95 in the short term.
Momentum indicators are still favoring buyers, and with Bitcoin stabilizing above $110K, ADA could soon attempt to break the psychological $1 level — a key area that could open the door toward $1.17–$1.33.
ปิดการเทรด ด้วยตนเอง
By analyzing the #Cardano (ADA) chart on the 3-day timeframe, we can see that after climbing to $0.7360, ADA faced renewed selling pressure and dropped as low as $0.5915. It’s now trading around $0.63, holding near a mid-range zone within its broader structure.While the overall market sentiment remains mixed, ADA’s chart suggests that it’s still in a correction and accumulation phase. The $0.58–$0.63 zone is currently acting as a minor support area, but there are no strong bullish signs yet — meaning price might continue to consolidate for a while before its next major move.
Once momentum returns, ADA could still target $0.75, $0.85, and even $1.00, but for now, traders should stay patient and watch for clearer reversal signals before re-entering aggressively.

📘 Wanna Learn ICT & SMC? Get the Full Book Here : bit.ly/ICT-BOOK
⚜️ Free Telegram Channel : telegram.me/PriceAction_ICT
⚜️ JOIN THE VIP 👉 t.me/ArmanShabanTrading
🚀 MondFX — our trusted Broker : bit.ly/MondFx
⚜️ Free Telegram Channel : telegram.me/PriceAction_ICT
⚜️ JOIN THE VIP 👉 t.me/ArmanShabanTrading
🚀 MondFX — our trusted Broker : bit.ly/MondFx
การนำเสนอที่เกี่ยวข้อง
คำจำกัดสิทธิ์ความรับผิดชอบ
ข้อมูลและบทความไม่ได้มีวัตถุประสงค์เพื่อก่อให้เกิดกิจกรรมทางการเงิน, การลงทุน, การซื้อขาย, ข้อเสนอแนะ หรือคำแนะนำประเภทอื่น ๆ ที่ให้หรือรับรองโดย TradingView อ่านเพิ่มเติมใน ข้อกำหนดการใช้งาน
📘 Wanna Learn ICT & SMC? Get the Full Book Here : bit.ly/ICT-BOOK
⚜️ Free Telegram Channel : telegram.me/PriceAction_ICT
⚜️ JOIN THE VIP 👉 t.me/ArmanShabanTrading
🚀 MondFX — our trusted Broker : bit.ly/MondFx
⚜️ Free Telegram Channel : telegram.me/PriceAction_ICT
⚜️ JOIN THE VIP 👉 t.me/ArmanShabanTrading
🚀 MondFX — our trusted Broker : bit.ly/MondFx
การนำเสนอที่เกี่ยวข้อง
คำจำกัดสิทธิ์ความรับผิดชอบ
ข้อมูลและบทความไม่ได้มีวัตถุประสงค์เพื่อก่อให้เกิดกิจกรรมทางการเงิน, การลงทุน, การซื้อขาย, ข้อเสนอแนะ หรือคำแนะนำประเภทอื่น ๆ ที่ให้หรือรับรองโดย TradingView อ่านเพิ่มเติมใน ข้อกำหนดการใช้งาน