
Every Saturday I open the weekly charts. The first chart I opened this week was ADBE.
I think ADBE stock has been unfairly battered recently. The revenue has been steadily rising despite the stock price dropping. That itself is a bit of bullish divergence.
Also, it needs mentioning that I'm photographer by trade. I use ADBE products every day. I understand the competition they're now facing. I also understand that for the past 20 years, every time a new product has come out with a feature drawing people away, ADBE has added it quickly and made that other program useless. Moreover, while all other stocks are getting high valuations, ADBE is being hurt by it - despite their AI development being top notch.
ADBE has a forward P/E somewhere around 15x. That's great value.
Ok, so let's go over to the chart and see why I think it's time to start accumulating ADBE.
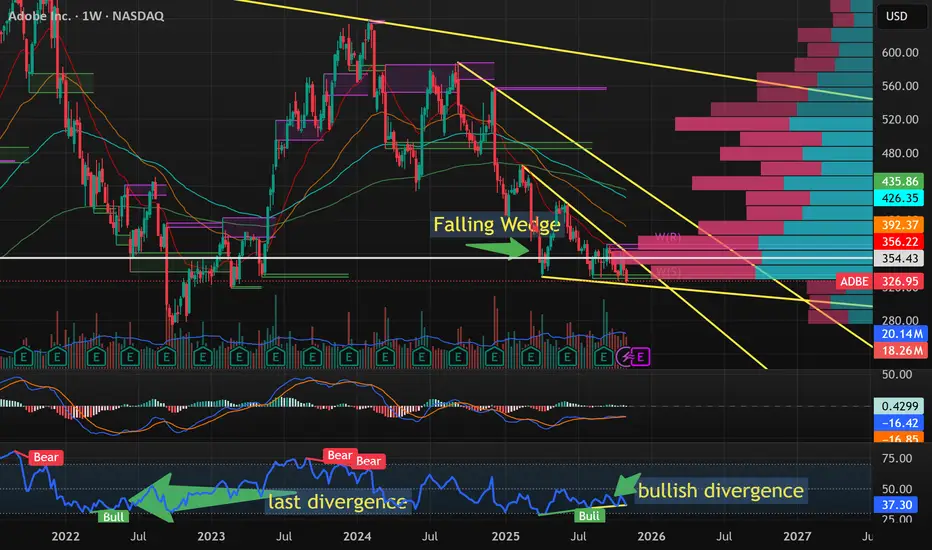
1. Price action is in a falling wedge. This is bullish pattern. It means that the selling pressure is slowly dying off. Eventually, these patterns generally break upwards
2. Ancient support. There's a lot of support here from late 2022 and 2023.
3. There's bullish divergence on the RSI. The last time there was bullish divergence was around April 2022. When that happened, the price $334 to $450 in a couple months. Of course, afterwards it crashed down with everything else on the market in the summer (from $450 down to $273). After that bottom, it went on a wild rally from $273 to $630 over the following 14-16 months.
So here we are, will history repeat? I'm going to start DCA'ing a position on Monday. But I won't be doing a traditional DCA. More a RDCA (Red Day Cost Average), any day ADBE closes red, I'll add.
I have 2 targets:
- Target 1 = $415 where the neckline is of the double bottom pattern).
- Target 2 = $480 there's a volume gap up to $480 if the pattern breaks.
I'll go active here on Monday, and update every time I add.
I think ADBE stock has been unfairly battered recently. The revenue has been steadily rising despite the stock price dropping. That itself is a bit of bullish divergence.
Also, it needs mentioning that I'm photographer by trade. I use ADBE products every day. I understand the competition they're now facing. I also understand that for the past 20 years, every time a new product has come out with a feature drawing people away, ADBE has added it quickly and made that other program useless. Moreover, while all other stocks are getting high valuations, ADBE is being hurt by it - despite their AI development being top notch.
ADBE has a forward P/E somewhere around 15x. That's great value.
Ok, so let's go over to the chart and see why I think it's time to start accumulating ADBE.
1. Price action is in a falling wedge. This is bullish pattern. It means that the selling pressure is slowly dying off. Eventually, these patterns generally break upwards
2. Ancient support. There's a lot of support here from late 2022 and 2023.
3. There's bullish divergence on the RSI. The last time there was bullish divergence was around April 2022. When that happened, the price $334 to $450 in a couple months. Of course, afterwards it crashed down with everything else on the market in the summer (from $450 down to $273). After that bottom, it went on a wild rally from $273 to $630 over the following 14-16 months.
So here we are, will history repeat? I'm going to start DCA'ing a position on Monday. But I won't be doing a traditional DCA. More a RDCA (Red Day Cost Average), any day ADBE closes red, I'll add.
I have 2 targets:
- Target 1 = $415 where the neckline is of the double bottom pattern).
- Target 2 = $480 there's a volume gap up to $480 if the pattern breaks.
I'll go active here on Monday, and update every time I add.
การซื้อขายยังคงดำเนินอยู่
The trade is active. I've opened 20% of my position.My average is 329.60
I'll add another 20% at close on any day ADBE is red until my maximum position.
As mentioned:
TP1 = $415
TP2 = $480
We're in this trade for the long run!
บันทึก
Ended green yesterday, so no buy today.บันทึก
In my opinion a bullish week. The whole market got smoked on Thursday and it held strong.I added 20% more of my position and my average is now $330.94.
The position size is at 40%, and the p/l is $0, 0%
บันทึก
Position size now 60%Average is 329.08
บันทึก
I don't want to rush the last 40% of this position. So I will only be adding once a week going forward, and only on red weeks.My average is $329.08
Currently the position is -0.7%
Will update every Saturday moving forward.
บันทึก
Oh man, the price action on ADBE is so boring. I think that's the reason that this stock never grows - it's boring.I did manage to do my second last buy.
My average is down to $326.57
The position is down 19%
บันทึก
The good news: we bounced. The bad news: the upper trendline is still holding.
The wild card: earnings next week means that structure might not matter.
I didn't buy anything this week.
But the position is now up 6.4%
I'm hoping for a bit of a bounce out of the wedge from the earnings call and maybe we can start a bit of an upward trend!
บันทึก
The trendline on the Daily chart is officially broken. On Friday we tested the weekly resistance from late October but didn't have enough momentum to break it. I feel like this week we're going to see some consolidation between $345-$355 before we attempt to break upwards again. But I do think the momentum has swung to the upside.A good start to things, and I still have about 20% of my position I can still load into this.
My current position is up 8.8%
บันทึก
I feel like if we keep turning the corner this could spike upwards.Position is now up 9.8%
บันทึก
We're holding in a bit of positive consolidation right at the resistance level of $360, if we break that it unlocks $370 which if that breaks could trigger a bit of a rally momentum. Position is down this week to +8.5%. Still a decent move.
I've also set a stop loss at $335 (which would guarantee a winning trade - although a soft one), but I could buy back in again at the lower trendline again.
The only thing worse than selling too early is bag holding.

คำจำกัดสิทธิ์ความรับผิดชอบ
ข้อมูลและบทความไม่ได้มีวัตถุประสงค์เพื่อก่อให้เกิดกิจกรรมทางการเงิน, การลงทุน, การซื้อขาย, ข้อเสนอแนะ หรือคำแนะนำประเภทอื่น ๆ ที่ให้หรือรับรองโดย TradingView อ่านเพิ่มเติมใน ข้อกำหนดการใช้งาน
คำจำกัดสิทธิ์ความรับผิดชอบ
ข้อมูลและบทความไม่ได้มีวัตถุประสงค์เพื่อก่อให้เกิดกิจกรรมทางการเงิน, การลงทุน, การซื้อขาย, ข้อเสนอแนะ หรือคำแนะนำประเภทอื่น ๆ ที่ให้หรือรับรองโดย TradingView อ่านเพิ่มเติมใน ข้อกำหนดการใช้งาน