
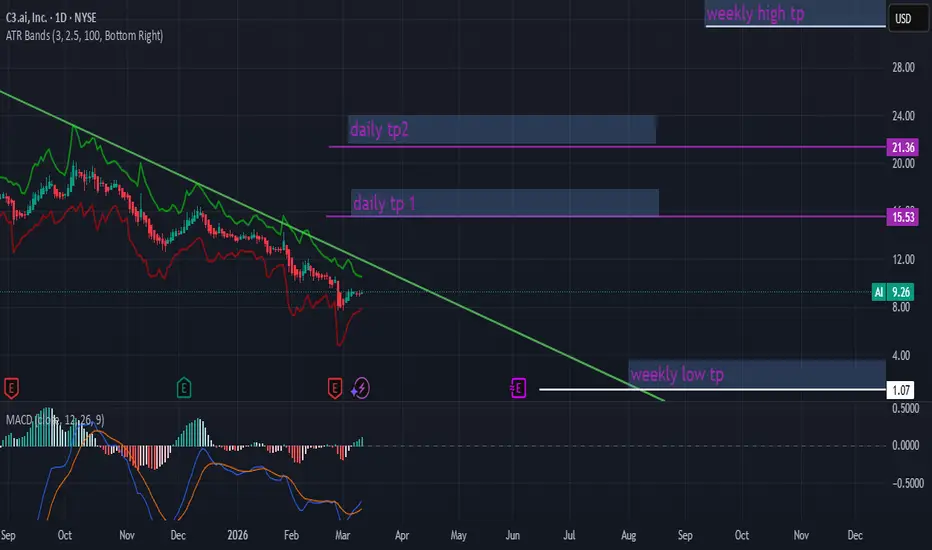
long-term charts 1W/1D, Macd for both charts, momentum is bearish but bearish momentum trend is shortening and getting weaker bulls momentum indicated more activity on bulls side.
candle situation on bears side confirm slowed momentum and less activity creating a weak bearish trend.
Short-term charts 4h/1h/15m, suggests the markets longterm charts 1w/1d are playing catch up so expect to see lower timeframes take dips to transcend higher from lower positions . shorter timeframes macd all suggest market has been trending mainly in a bearish state and look to make the switch to the bulls side, need ai/tech sector confirmation for investor sentiment to commit to longterm trading, if market doesnt make the transition on its own. expect market to test the waters of the bullish side of things, look for long-term commitment for investor sentiment certainty.
candle situation on bears side confirm slowed momentum and less activity creating a weak bearish trend.
Short-term charts 4h/1h/15m, suggests the markets longterm charts 1w/1d are playing catch up so expect to see lower timeframes take dips to transcend higher from lower positions . shorter timeframes macd all suggest market has been trending mainly in a bearish state and look to make the switch to the bulls side, need ai/tech sector confirmation for investor sentiment to commit to longterm trading, if market doesnt make the transition on its own. expect market to test the waters of the bullish side of things, look for long-term commitment for investor sentiment certainty.

การนำเสนอที่เกี่ยวข้อง
คำจำกัดสิทธิ์ความรับผิดชอบ
ข้อมูลและบทความไม่ได้มีวัตถุประสงค์เพื่อก่อให้เกิดกิจกรรมทางการเงิน, การลงทุน, การซื้อขาย, ข้อเสนอแนะ หรือคำแนะนำประเภทอื่น ๆ ที่ให้หรือรับรองโดย TradingView อ่านเพิ่มเติมใน ข้อกำหนดการใช้งาน
คำจำกัดสิทธิ์ความรับผิดชอบ
ข้อมูลและบทความไม่ได้มีวัตถุประสงค์เพื่อก่อให้เกิดกิจกรรมทางการเงิน, การลงทุน, การซื้อขาย, ข้อเสนอแนะ หรือคำแนะนำประเภทอื่น ๆ ที่ให้หรือรับรองโดย TradingView อ่านเพิ่มเติมใน ข้อกำหนดการใช้งาน