Long
AKITA/USD
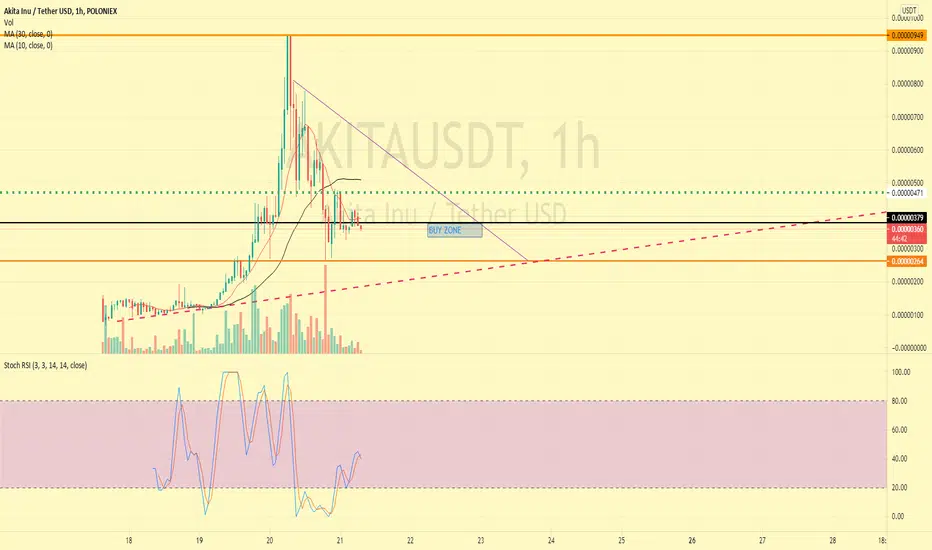
After running up 16000% in 7 days, AKITA profit taking happened for a healthy correction.
The [rice action data on Trading View is limited so had to work with lower time frame (1HR) to with help from 4HR and Daily to create this chart and what I believe is a good initial or buy-back-in zone based on trend, support, resistance action and a stochastic RSI cross on the 4HR, inside the oversold zone, shows downward pressure is weakening.
So we can expect a reversal to the upside soon to test the marked resistance level above.
If you get into #AKITA, Hodl Hodl Hodl!!!
The [rice action data on Trading View is limited so had to work with lower time frame (1HR) to with help from 4HR and Daily to create this chart and what I believe is a good initial or buy-back-in zone based on trend, support, resistance action and a stochastic RSI cross on the 4HR, inside the oversold zone, shows downward pressure is weakening.
So we can expect a reversal to the upside soon to test the marked resistance level above.
If you get into #AKITA, Hodl Hodl Hodl!!!

คำจำกัดสิทธิ์ความรับผิดชอบ
ข้อมูลและบทความไม่ได้มีวัตถุประสงค์เพื่อก่อให้เกิดกิจกรรมทางการเงิน, การลงทุน, การซื้อขาย, ข้อเสนอแนะ หรือคำแนะนำประเภทอื่น ๆ ที่ให้หรือรับรองโดย TradingView อ่านเพิ่มเติมใน ข้อกำหนดการใช้งาน
คำจำกัดสิทธิ์ความรับผิดชอบ
ข้อมูลและบทความไม่ได้มีวัตถุประสงค์เพื่อก่อให้เกิดกิจกรรมทางการเงิน, การลงทุน, การซื้อขาย, ข้อเสนอแนะ หรือคำแนะนำประเภทอื่น ๆ ที่ให้หรือรับรองโดย TradingView อ่านเพิ่มเติมใน ข้อกำหนดการใช้งาน