
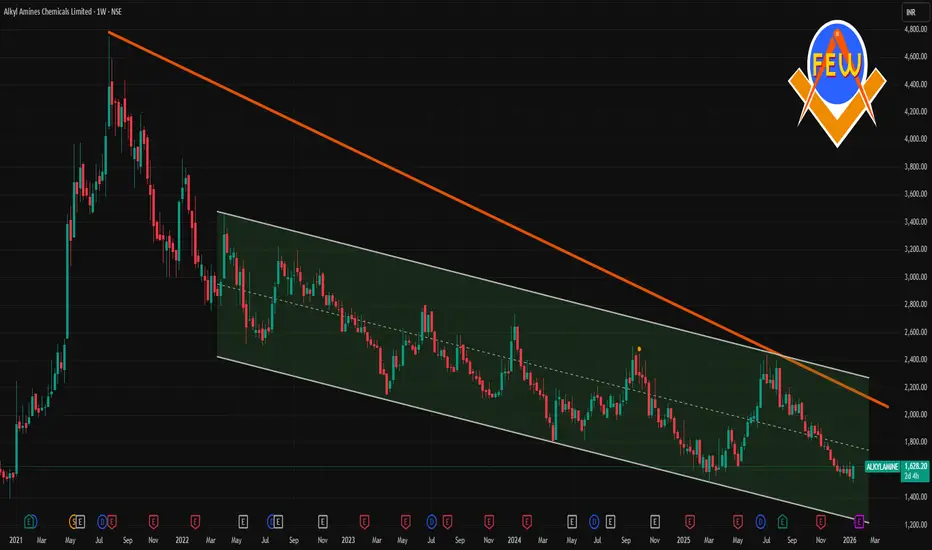
📌 Current Price (Latest Market Levels)
Approximate current trading price: ₹1,570 – ₹1,610 range on NSE (mid‑January 2026) — slightly below recent intraday highs/lows around this zone.
52‑week range: Low ~₹1,506 • High ~₹2,438.
Short‑term price action has been slightly bearish to neutral around this zone with some down‑side pressure evident.
📈 1‑Week (Weekly) Technical Levels
🔑 Weekly Pivot Levels
These come from multiple pivot calculations (classic & fibo), giving a weekly frame support/resistance range:
Weekly Pivot Zone
Pivot (~1,580 – 1,584) — acts as the mid‑point level this week.
Weekly Resistance
R1: ~₹1,610 – 1,615 (first resistance ahead).
R2: ~₹1,630 – 1,650 (stronger resistance).
R3: ~₹1,670 – 1,680 (broader weekly upper target).
Weekly Support
S1: ~₹1,545 – 1,555 (initial support).
S2: ~₹1,520 – 1,530 (deeper support).
S3: ~₹1,485 – 1,495 (significant near‑term buffer).
📌 Weekly pivot levels are useful to gauge if price holds above support — which implies stay bullish weekly — or breaks down through support — into bearish continuation.
💡 What This Means for the Next 1 Week
✅ Key levels to watch for directional bias:
Weekly Bullish trigger: Close above ₹1,610‑1,615
Weekly bearish trigger: Close below ₹1,545

Contact Knowledgehub for a detailed consultation: Dm on WhatsApp: [wa.link/a2o0kz]-
Phone No: [+91 93102 26243]-
Email: [tradingviewknowledgehub@gmail.com]---
-- Let’s achieve success together!
Phone No: [+91 93102 26243]-
Email: [tradingviewknowledgehub@gmail.com]---
-- Let’s achieve success together!
การนำเสนอที่เกี่ยวข้อง
คำจำกัดสิทธิ์ความรับผิดชอบ
ข้อมูลและบทความไม่ได้มีวัตถุประสงค์เพื่อก่อให้เกิดกิจกรรมทางการเงิน, การลงทุน, การซื้อขาย, ข้อเสนอแนะ หรือคำแนะนำประเภทอื่น ๆ ที่ให้หรือรับรองโดย TradingView อ่านเพิ่มเติมใน ข้อกำหนดการใช้งาน