
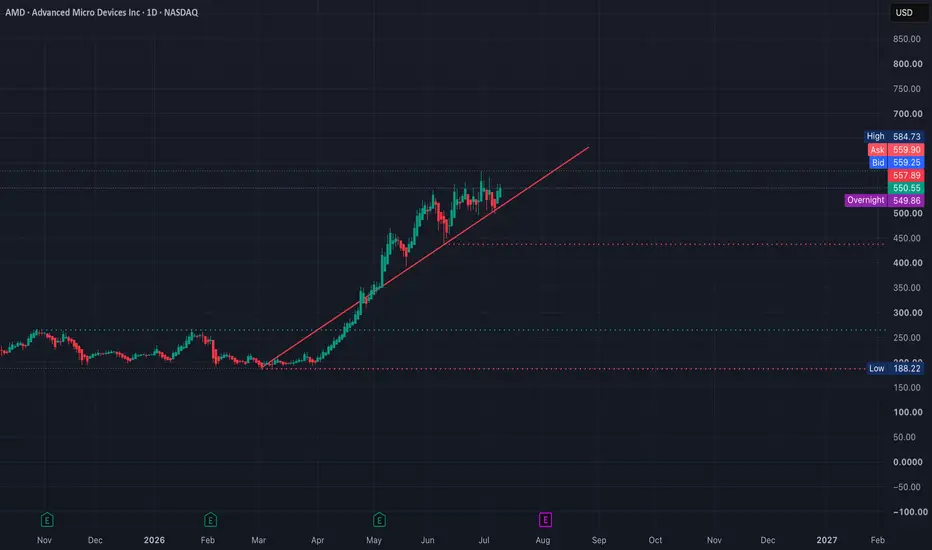
AMD is coming into this week with strong momentum, but price is sitting right under an important decision area around 560–565. The daily trend is still bullish, and the 15-minute chart shows AMD recovering from 537, reclaiming 550 and 555, then holding tight near the highs.
This is a good setup, but I would not chase it here. I want to see AMD clearly break and hold above 560.25–565 before calling for the next leg higher.
Daily Chart
The daily structure still looks strong with higher highs and higher lows, and price continues to respect the rising trendline.
The main upside level is the previous high around 584.73. If AMD can break above that area and hold, I will be watching 590 and then 600.
As long as AMD stays above the recent 537 swing low, the larger bullish structure remains intact. A break below 537 would be the first real warning that the trend is starting to weaken.
15-Minute Chart
On the 15-minute chart, AMD made a strong move from 537 and is now consolidating just under 560.25.
This tight consolidation near the highs is bullish, but traders still need confirmation. I would rather wait for a 15-minute candle to close above resistance and then see if buyers can defend the retest.
The short-term structure remains bullish above 555–556. If AMD holds this area, buyers can continue pushing into 560.25 and 565.
If 555 fails, price may rotate back toward 552.50 and 550.
Key Levels
Resistance: 560.25, 565, 580, 584.73, 590, 600
Support: 557–555, 552.50, 550–547.50, 539.50–537, 530, 515
GEX Positioning
The GEX chart shows AMD trading between support around 555 and 552.50, with the first major upside resistance around 565.
Above 565, the next important call levels are 580, 590 and 600. The 590 area appears to have the strongest overhead call concentration, which also lines up closely with the daily resistance around 584.73.
That makes the 580–590 area an important target zone, but also an area where price could slow down or reject.
On the downside, 547.50 is the first important put level. If AMD loses 547.50, volatility could increase and push price back toward 537 and 530.
The deeper downside GEX support is around 515.
Bullish Scenario
For the bullish setup, I want AMD to hold 555 and break 560.25 with strong volume.
A clean 15-minute close above 565, followed by a successful retest, would give a better confirmation for continuation.
The upside targets would be 580, 584.73 and then 590.
If AMD can accept above 590, the next major target would be 600.
Bearish Scenario
For the bearish setup, I will watch for repeated rejection around 560.25–565.
If AMD rejects this area and then loses 555, the short-term momentum will start weakening.
Below 552.50, price could move back toward the 550–547.50 support zone.
A confirmed break below 547.50 would open the door toward 539.50–537.
If 537 fails, the recent higher-low structure would break, and 530 could become the next downside target.
Trade Considerations
This week has several major market catalysts, so AMD may react more to the overall Nasdaq and semiconductor sector than to its own company news.
Because the options premium is already elevated, I would avoid chasing the first move. I would rather wait for the opening range, VWAP confirmation and a clean breakout or breakdown retest.
Inside the 555–565 range, AMD could stay choppy and pinned by GEX. The better trade may come only after price clearly leaves this range.
Conclusion
AMD still looks bullish, but 560.25–565 is the main decision zone.
Above 565, I will watch 580, 584.73, 590 and 600.
Below 547.50, I will watch 539.50, 537 and 530.
The main question this week is whether AMD can break out of the 555–565 GEX range or continue trading sideways until a major market catalyst creates the next move.

Built for traders who want clarity, not noise.
bullbearxinsights.app
bullbearxinsights.app
คำจำกัดสิทธิ์ความรับผิดชอบ
ข้อมูลและบทความไม่ได้มีวัตถุประสงค์เพื่อก่อให้เกิดกิจกรรมทางการเงิน, การลงทุน, การซื้อขาย, ข้อเสนอแนะ หรือคำแนะนำประเภทอื่น ๆ ที่ให้หรือรับรองโดย TradingView อ่านเพิ่มเติมใน ข้อกำหนดการใช้งาน
Built for traders who want clarity, not noise.
bullbearxinsights.app
bullbearxinsights.app
คำจำกัดสิทธิ์ความรับผิดชอบ
ข้อมูลและบทความไม่ได้มีวัตถุประสงค์เพื่อก่อให้เกิดกิจกรรมทางการเงิน, การลงทุน, การซื้อขาย, ข้อเสนอแนะ หรือคำแนะนำประเภทอื่น ๆ ที่ให้หรือรับรองโดย TradingView อ่านเพิ่มเติมใน ข้อกำหนดการใช้งาน