
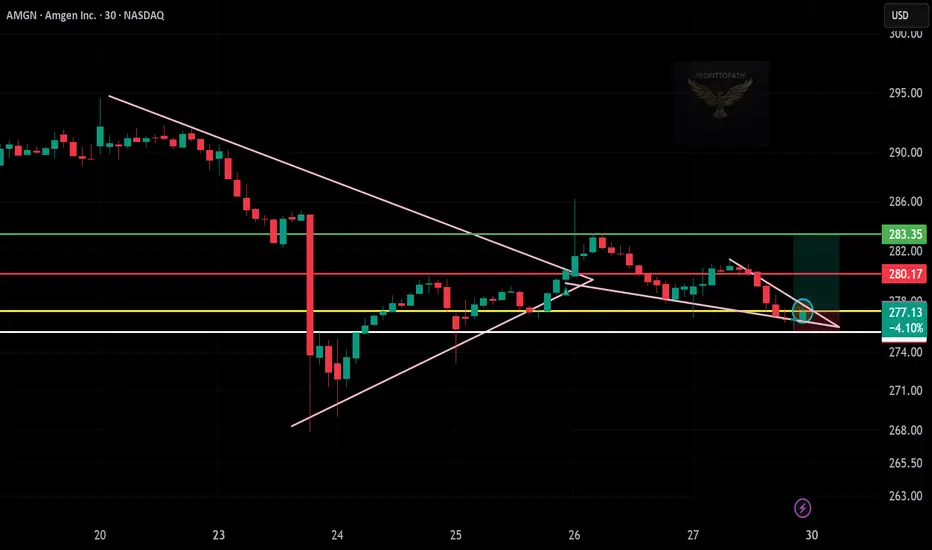
📈
🕒 Timeframe: 30 min
🔻 Pattern: Falling wedge nearing breakout 🔼
📍 Entry Zone: ~$277.00 ✅
🎯 Target: $283.35 💰
🛑 Stop Loss: Below $274.00 ⚠️
🔥 Why It Looks Bullish:
🔺 Falling wedge structure — a known bullish pattern
🧱 Strong bounce off demand zone (support + yellow line)
💚 Green reversal candle forming at wedge tip
📈 Risk-to-reward ratio is attractive for swing/short-term
🕒 Timeframe: 30 min
🔻 Pattern: Falling wedge nearing breakout 🔼
📍 Entry Zone: ~$277.00 ✅
🎯 Target: $283.35 💰
🛑 Stop Loss: Below $274.00 ⚠️
🔥 Why It Looks Bullish:
🔺 Falling wedge structure — a known bullish pattern
🧱 Strong bounce off demand zone (support + yellow line)
💚 Green reversal candle forming at wedge tip
📈 Risk-to-reward ratio is attractive for swing/short-term

คำจำกัดสิทธิ์ความรับผิดชอบ
ข้อมูลและบทความไม่ได้มีวัตถุประสงค์เพื่อก่อให้เกิดกิจกรรมทางการเงิน, การลงทุน, การซื้อขาย, ข้อเสนอแนะ หรือคำแนะนำประเภทอื่น ๆ ที่ให้หรือรับรองโดย TradingView อ่านเพิ่มเติมใน ข้อกำหนดการใช้งาน
คำจำกัดสิทธิ์ความรับผิดชอบ
ข้อมูลและบทความไม่ได้มีวัตถุประสงค์เพื่อก่อให้เกิดกิจกรรมทางการเงิน, การลงทุน, การซื้อขาย, ข้อเสนอแนะ หรือคำแนะนำประเภทอื่น ๆ ที่ให้หรือรับรองโดย TradingView อ่านเพิ่มเติมใน ข้อกำหนดการใช้งาน