
Long Term Story:
📈 The Setup
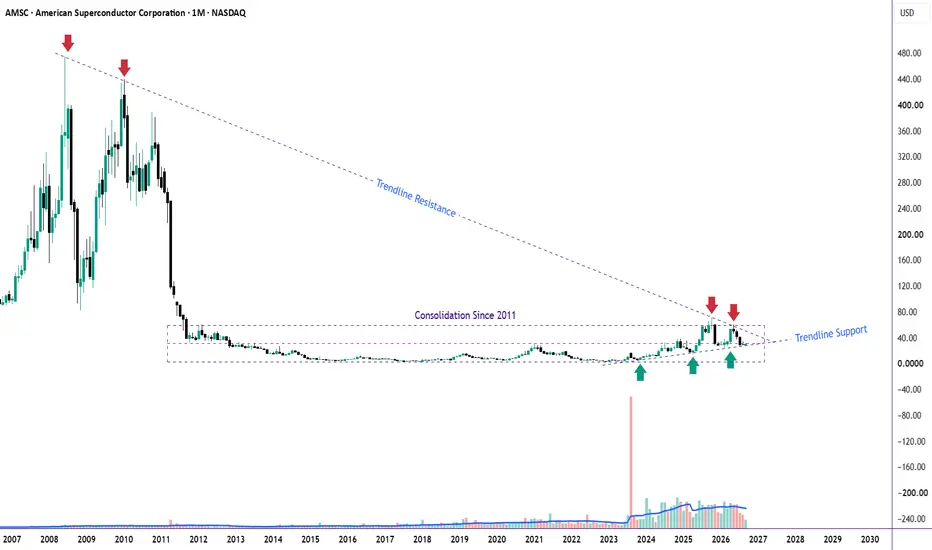
American Superconductor peaked at ~$480 in 2008, made a lower high near $440 in 2010 (double-top distribution 🔻🔻), then collapsed over 95% into a dead, 13-year sideways base that most traders forgot existed.
🔋 The Wake-Up
Since 2023, volume has come back to life for the first time in over a decade 📊, and price has been grinding higher off that long base — something this stock hasn't done since the bubble years.
⚠️ The Squeeze
Here's the real story: the descending trendline connecting the 2008 and 2010 highs is now converging with the top of the 2011-2026 consolidation range. Two attempts to break through (🔻 marked on the chart) have already failed. The gap between falling trendline resistance and the range ceiling is shrinking — a coil that's been over a decade in the making.
👀 Levels to Watch
🔺 Resistance / breakout trigger: the trendline + range-top confluence zone (confirm exact value on the chart — it's tightening month to month as the trendline descends)
🔻 Structure support: the recent higher-low base built since 2023-2024
✅ Confirmation: a monthly close above the confluence zone, ideally on expanding volume
❌ Invalidation: a third rejection here keeps this a 15+ year range, not a breakout
🧠 Why it matters: A clean break above this level would be the first time since the 2008 bubble that AMSC has closed above the trendline that capped every major top since. That's not a minor technical event for a stock this dormant.
I will be posting a closeup weekly view, why I think AMSC is going to make another breakout attempt.
📈 The Setup
American Superconductor peaked at ~$480 in 2008, made a lower high near $440 in 2010 (double-top distribution 🔻🔻), then collapsed over 95% into a dead, 13-year sideways base that most traders forgot existed.
🔋 The Wake-Up
Since 2023, volume has come back to life for the first time in over a decade 📊, and price has been grinding higher off that long base — something this stock hasn't done since the bubble years.
⚠️ The Squeeze
Here's the real story: the descending trendline connecting the 2008 and 2010 highs is now converging with the top of the 2011-2026 consolidation range. Two attempts to break through (🔻 marked on the chart) have already failed. The gap between falling trendline resistance and the range ceiling is shrinking — a coil that's been over a decade in the making.
👀 Levels to Watch
🔺 Resistance / breakout trigger: the trendline + range-top confluence zone (confirm exact value on the chart — it's tightening month to month as the trendline descends)
🔻 Structure support: the recent higher-low base built since 2023-2024
✅ Confirmation: a monthly close above the confluence zone, ideally on expanding volume
❌ Invalidation: a third rejection here keeps this a 15+ year range, not a breakout
🧠 Why it matters: A clean break above this level would be the first time since the 2008 bubble that AMSC has closed above the trendline that capped every major top since. That's not a minor technical event for a stock this dormant.
I will be posting a closeup weekly view, why I think AMSC is going to make another breakout attempt.

📊 Charts → 🏗️ Structure → 🎯 Probability =📖 Chart Story
⏳ Patience → 🚀Success
🎯 If this setup makes sense to you, show it some support with a Boost.
⏳ Patience → 🚀Success
🎯 If this setup makes sense to you, show it some support with a Boost.
คำจำกัดสิทธิ์ความรับผิดชอบ
ข้อมูลและบทความไม่ได้มีวัตถุประสงค์เพื่อก่อให้เกิดกิจกรรมทางการเงิน, การลงทุน, การซื้อขาย, ข้อเสนอแนะ หรือคำแนะนำประเภทอื่น ๆ ที่ให้หรือรับรองโดย TradingView อ่านเพิ่มเติมใน ข้อกำหนดการใช้งาน
📊 Charts → 🏗️ Structure → 🎯 Probability =📖 Chart Story
⏳ Patience → 🚀Success
🎯 If this setup makes sense to you, show it some support with a Boost.
⏳ Patience → 🚀Success
🎯 If this setup makes sense to you, show it some support with a Boost.
คำจำกัดสิทธิ์ความรับผิดชอบ
ข้อมูลและบทความไม่ได้มีวัตถุประสงค์เพื่อก่อให้เกิดกิจกรรมทางการเงิน, การลงทุน, การซื้อขาย, ข้อเสนอแนะ หรือคำแนะนำประเภทอื่น ๆ ที่ให้หรือรับรองโดย TradingView อ่านเพิ่มเติมใน ข้อกำหนดการใช้งาน