
Hello Traders!
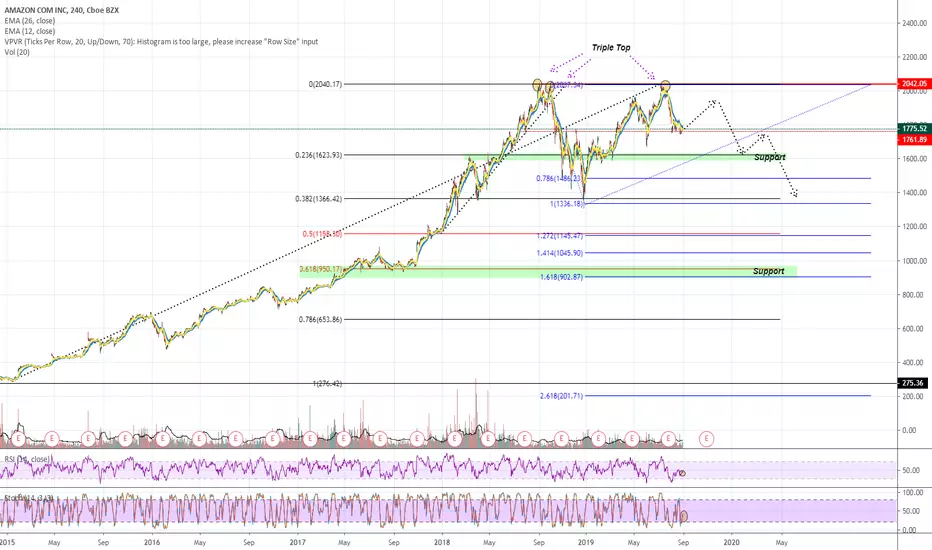
Today’s chart will be on the good old AMAZON, Potential Triple Top!?
Points to consider,
- Price failed to break the $2042.05 Region, posing a potential triple top
- Price currently testing local support but looks weak
- Stoch and RSI are both neutral
- EMA’s are currently bearish
- Volume is below average
- Fibonacci extension is in confluence with .618 retracement and support area, Potential target!
AMAZON’s recent developments show us that it may have just completed a triple top and is on its way down to test local supports. Bulls failed to break the $2042.05 resistance area on multiple occasions leaving the price testing current local support, which does look weak. EMA’s are also giving a hard to for Bulls to push price up…
The Stochastic and RSI levels are quite neutral as price is in no trading zone; we need to see a clear direction from this point, either bearish or bullish. Volume has tapered off, well below average trading, we could see a potential bounce here for AMAZON, but with a high degree of probability, we could be in for more downwards momentum.
The golden fib retracement - .618 - is in confluence with price support and fib extension -1.618, price has a higher degree of probability of retracing back to this area in the next couple month, only if this happens to be a triple top…
What are your thoughts on AMAZON?, is this potential triple top? a start of a correction?
Please leave a like and comment
And remember,
“If you don’t respect risk, eventually they’ll carry you out.” – Larry Hite
Today’s chart will be on the good old AMAZON, Potential Triple Top!?
Points to consider,
- Price failed to break the $2042.05 Region, posing a potential triple top
- Price currently testing local support but looks weak
- Stoch and RSI are both neutral
- EMA’s are currently bearish
- Volume is below average
- Fibonacci extension is in confluence with .618 retracement and support area, Potential target!
AMAZON’s recent developments show us that it may have just completed a triple top and is on its way down to test local supports. Bulls failed to break the $2042.05 resistance area on multiple occasions leaving the price testing current local support, which does look weak. EMA’s are also giving a hard to for Bulls to push price up…
The Stochastic and RSI levels are quite neutral as price is in no trading zone; we need to see a clear direction from this point, either bearish or bullish. Volume has tapered off, well below average trading, we could see a potential bounce here for AMAZON, but with a high degree of probability, we could be in for more downwards momentum.
The golden fib retracement - .618 - is in confluence with price support and fib extension -1.618, price has a higher degree of probability of retracing back to this area in the next couple month, only if this happens to be a triple top…
What are your thoughts on AMAZON?, is this potential triple top? a start of a correction?
Please leave a like and comment
And remember,
“If you don’t respect risk, eventually they’ll carry you out.” – Larry Hite

Join the Free Trading Group
Telegram: t.me/freetradingden 🔥
Claim $1000 Deposit Bonus 🎁
Trade with perks & support the community!
partner.blofin.com/d/TheAlchemist
Stay sharp, trade smart.
— Team The Alchemist ⚔️
Telegram: t.me/freetradingden 🔥
Claim $1000 Deposit Bonus 🎁
Trade with perks & support the community!
partner.blofin.com/d/TheAlchemist
Stay sharp, trade smart.
— Team The Alchemist ⚔️
คำจำกัดสิทธิ์ความรับผิดชอบ
ข้อมูลและบทความไม่ได้มีวัตถุประสงค์เพื่อก่อให้เกิดกิจกรรมทางการเงิน, การลงทุน, การซื้อขาย, ข้อเสนอแนะ หรือคำแนะนำประเภทอื่น ๆ ที่ให้หรือรับรองโดย TradingView อ่านเพิ่มเติมใน ข้อกำหนดการใช้งาน
Join the Free Trading Group
Telegram: t.me/freetradingden 🔥
Claim $1000 Deposit Bonus 🎁
Trade with perks & support the community!
partner.blofin.com/d/TheAlchemist
Stay sharp, trade smart.
— Team The Alchemist ⚔️
Telegram: t.me/freetradingden 🔥
Claim $1000 Deposit Bonus 🎁
Trade with perks & support the community!
partner.blofin.com/d/TheAlchemist
Stay sharp, trade smart.
— Team The Alchemist ⚔️
คำจำกัดสิทธิ์ความรับผิดชอบ
ข้อมูลและบทความไม่ได้มีวัตถุประสงค์เพื่อก่อให้เกิดกิจกรรมทางการเงิน, การลงทุน, การซื้อขาย, ข้อเสนอแนะ หรือคำแนะนำประเภทอื่น ๆ ที่ให้หรือรับรองโดย TradingView อ่านเพิ่มเติมใน ข้อกำหนดการใช้งาน