
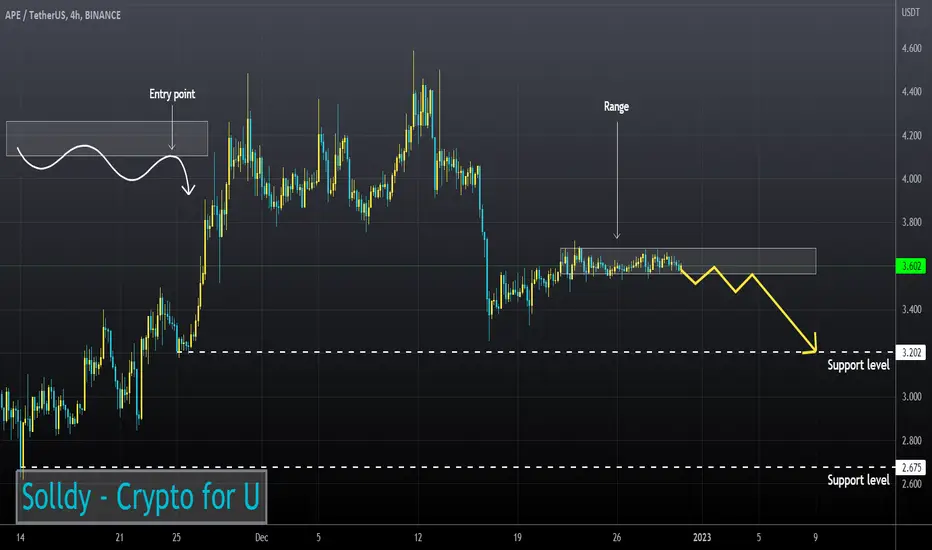
APE is trading near a strong resistance level.
On the 4H TF, price is testing 50EMA as resistance.
The RSI chart is in the sellers zone (4H, 1H and 30m TFs)
50EMA has broken down 200EMA (1H and 30m TFs)
I expect the asset may start to decline after price fixes below the current range.
On the 4H TF, price is testing 50EMA as resistance.
The RSI chart is in the sellers zone (4H, 1H and 30m TFs)
50EMA has broken down 200EMA (1H and 30m TFs)
I expect the asset may start to decline after price fixes below the current range.

การนำเสนอที่เกี่ยวข้อง
คำจำกัดสิทธิ์ความรับผิดชอบ
ข้อมูลและบทความไม่ได้มีวัตถุประสงค์เพื่อก่อให้เกิดกิจกรรมทางการเงิน, การลงทุน, การซื้อขาย, ข้อเสนอแนะ หรือคำแนะนำประเภทอื่น ๆ ที่ให้หรือรับรองโดย TradingView อ่านเพิ่มเติมใน ข้อกำหนดการใช้งาน
การนำเสนอที่เกี่ยวข้อง
คำจำกัดสิทธิ์ความรับผิดชอบ
ข้อมูลและบทความไม่ได้มีวัตถุประสงค์เพื่อก่อให้เกิดกิจกรรมทางการเงิน, การลงทุน, การซื้อขาย, ข้อเสนอแนะ หรือคำแนะนำประเภทอื่น ๆ ที่ให้หรือรับรองโดย TradingView อ่านเพิ่มเติมใน ข้อกำหนดการใช้งาน