
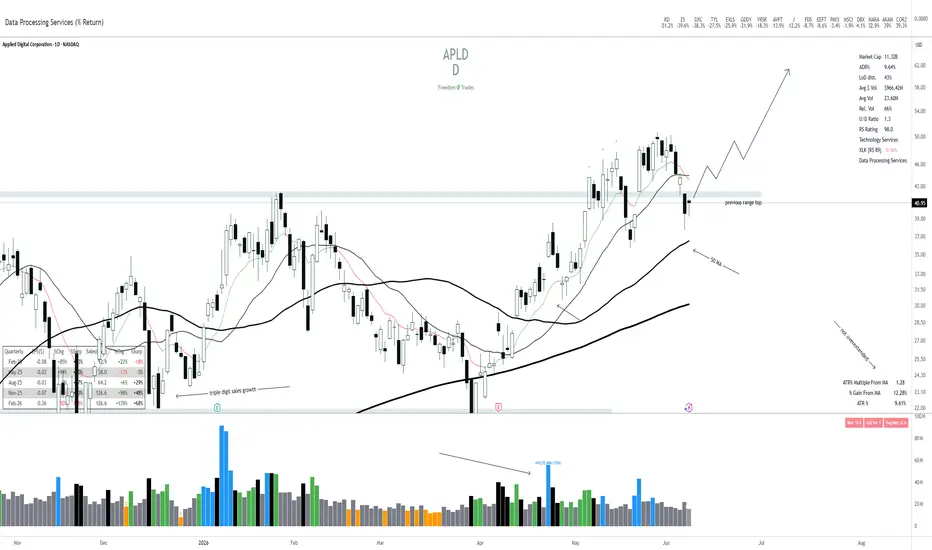
Applied Digital (APLD) is setting up a constructive bullish continuation pattern on the daily chart, with price pulling back into a key support zone while the primary trend remains up.
Trend and moving averages
APLD is trading above a rising 50 day moving average after a strong advance, which signals that buyers still control the intermediate trend.
Shorter term moving averages are stacked positively and starting to curl, a sign that the recent dip is more likely a pause in the uptrend than a complete trend reversal.
Key support zone
Price has pulled back into the previous range top area, which now acts as a major support zone.
Holding this shelf and building a higher low above the 50 day moving average would confirm that demand is stepping in and can provide a low risk area for swing entries.
Volume and accumulation
The prior leg up featured multiple wide range bullish candles on elevated volume, showing institutional interest during the advance.
The current pullback is occurring on relatively lighter volume, which suggests profit taking rather than aggressive distribution.
Bullish scenario
If APLD can stabilize in this support zone, reclaim short term moving averages, and push back above recent local highs, the chart opens the door for a measured move toward the prior high and then into the 50s.
For swing traders, the bullish thesis is to look for confirmation of a higher low near support, then target a trend continuation leg in line with the existing uptrend, while using the support area and 50 day moving average as key risk levels.
Trend and moving averages
APLD is trading above a rising 50 day moving average after a strong advance, which signals that buyers still control the intermediate trend.
Shorter term moving averages are stacked positively and starting to curl, a sign that the recent dip is more likely a pause in the uptrend than a complete trend reversal.
Key support zone
Price has pulled back into the previous range top area, which now acts as a major support zone.
Holding this shelf and building a higher low above the 50 day moving average would confirm that demand is stepping in and can provide a low risk area for swing entries.
Volume and accumulation
The prior leg up featured multiple wide range bullish candles on elevated volume, showing institutional interest during the advance.
The current pullback is occurring on relatively lighter volume, which suggests profit taking rather than aggressive distribution.
Bullish scenario
If APLD can stabilize in this support zone, reclaim short term moving averages, and push back above recent local highs, the chart opens the door for a measured move toward the prior high and then into the 50s.
For swing traders, the bullish thesis is to look for confirmation of a higher low near support, then target a trend continuation leg in line with the existing uptrend, while using the support area and 50 day moving average as key risk levels.

Catch the move before it happens - ft.wtf/subscribe
Join 2,000+ traders.
Join 2,000+ traders.
คำจำกัดสิทธิ์ความรับผิดชอบ
ข้อมูลและบทความไม่ได้มีวัตถุประสงค์เพื่อก่อให้เกิดกิจกรรมทางการเงิน, การลงทุน, การซื้อขาย, ข้อเสนอแนะ หรือคำแนะนำประเภทอื่น ๆ ที่ให้หรือรับรองโดย TradingView อ่านเพิ่มเติมใน ข้อกำหนดการใช้งาน
Catch the move before it happens - ft.wtf/subscribe
Join 2,000+ traders.
Join 2,000+ traders.
คำจำกัดสิทธิ์ความรับผิดชอบ
ข้อมูลและบทความไม่ได้มีวัตถุประสงค์เพื่อก่อให้เกิดกิจกรรมทางการเงิน, การลงทุน, การซื้อขาย, ข้อเสนอแนะ หรือคำแนะนำประเภทอื่น ๆ ที่ให้หรือรับรองโดย TradingView อ่านเพิ่มเติมใน ข้อกำหนดการใช้งาน