
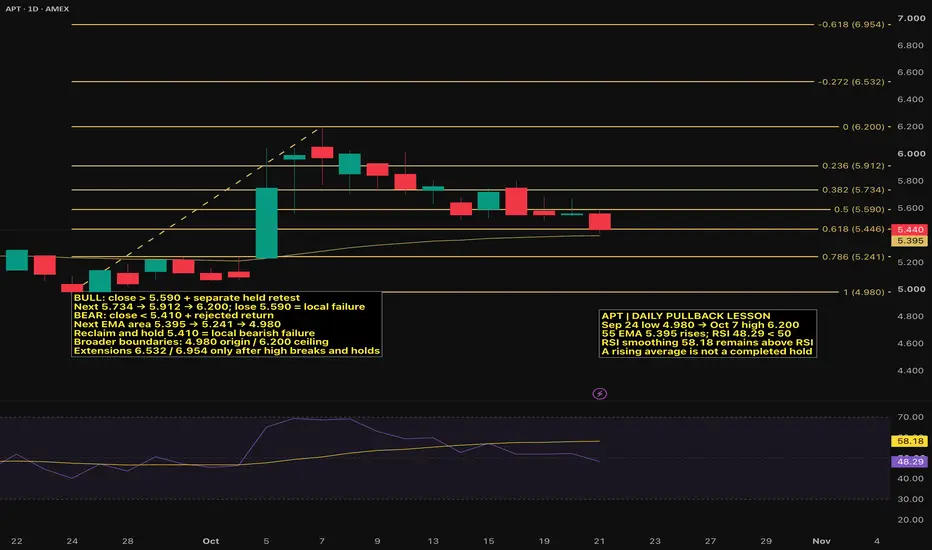
Alpha Pro Tech's completed October 21 daily chart puts a rising 55 EMA beside a falling pullback. Price closed at 5.440, down 0.120 or 2.16%, after opening at 5.560, reaching 5.590 and testing 5.410. Volume was approximately 76.78 thousand shares. The 55 EMA is 5.395 and has risen through the recent window. RSI is 48.29, below 50 and below its smoothing line at 58.18. Those observations can coexist because an average price trend and recent momentum answer different questions.
The company makes protective apparel and construction weatherization products. Housing activity and customer demand matter to its business, but this chart does not establish a fresh earnings outcome, a demand change or the cause of the pullback. The lesson is about how to test price retention rather than turning a moving-average slope into a business forecast.
The measured advance runs from September 24's 4.980 low to October 7's 6.200 high, a 1.220-point range. The first anchor closed at its low after opening at 5.041. The second opened at 6.050 and closed at 5.970 after reaching 6.200, leaving an upper wick inside a red body. The dashed diagonal joins those endpoints; it is not an independently established multi-touch trendline.
Subtracting retracement fractions from 6.200 gives 5.912 at 23.6%, 5.734 at 38.2%, 5.590 halfway, 5.446 at 61.8% and 5.241 at 78.6%, before the 4.980 origin. Halfway is a measuring convention rather than a Fibonacci-sequence ratio. The latest 5.440 close is slightly below 5.446 but still above the 5.395 EMA. Being near both references does not confirm a held support test.
A constructive route requires a completed daily close above 5.590, then a separate pullback that holds with a higher low. The next checkpoints are 5.734, 5.912 and the actual 6.200 ceiling. Only a further break and held retest of that high would make the 6.532 and 6.954 extensions useful conditional projections. Losing a reclaimed 5.590 defeats the immediate sequence; a completed loss of 4.980 invalidates the broader retention of this measured advance.
A weaker route requires a completed close below 5.410 and rejection on the return. The current EMA area near 5.395 is the first nearby assessment, followed by 5.241 and 4.980. The EMA changes with new candles and is not a frozen future price. Reclaiming 5.410 and retaining it defeats that immediate breakdown sequence. Acceptance above 6.200 challenges the broader pullback premise.
The rising EMA does not override a failed retest, and the softer RSI does not guarantee another decline. No divergence or wave count is assumed. Wait when gaps, available size, spread or distance to a defensible failure point make the setup unsuitable; no order or fill is claimed. Discussion: would you require a held recovery of the 5.590 midpoint, or first judge whether 5.410 and the rising EMA survive another test—and which completed candle would change your answer?

คำจำกัดสิทธิ์ความรับผิดชอบ
ข้อมูลและบทความไม่ได้มีวัตถุประสงค์เพื่อก่อให้เกิดกิจกรรมทางการเงิน, การลงทุน, การซื้อขาย, ข้อเสนอแนะ หรือคำแนะนำประเภทอื่น ๆ ที่ให้หรือรับรองโดย TradingView อ่านเพิ่มเติมใน ข้อกำหนดการใช้งาน
คำจำกัดสิทธิ์ความรับผิดชอบ
ข้อมูลและบทความไม่ได้มีวัตถุประสงค์เพื่อก่อให้เกิดกิจกรรมทางการเงิน, การลงทุน, การซื้อขาย, ข้อเสนอแนะ หรือคำแนะนำประเภทอื่น ๆ ที่ให้หรือรับรองโดย TradingView อ่านเพิ่มเติมใน ข้อกำหนดการใช้งาน