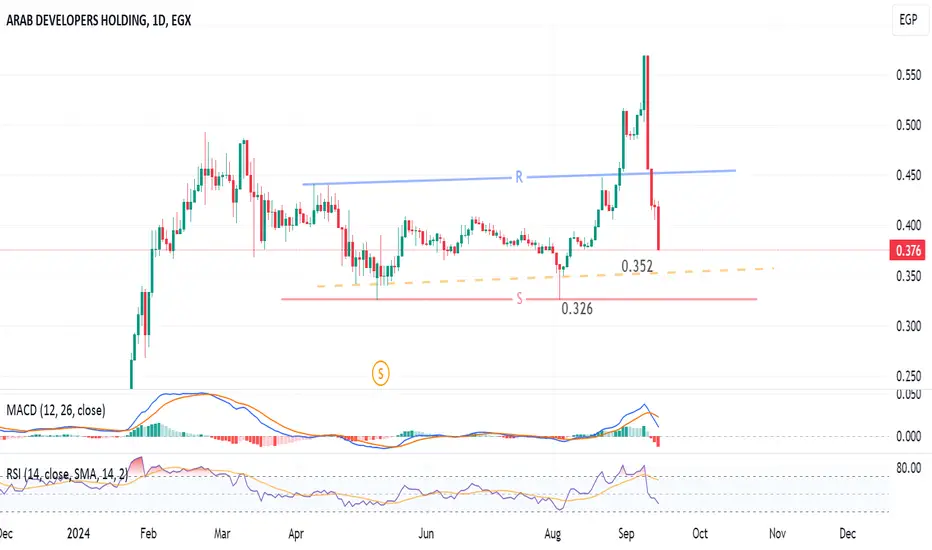
Daily chart, the stock  ARAB has been falling badly. The pattern is showing a possibility for 2 rebound levels: 0.352 and 0.326
Technical indicators:
RSI is near a BUY zone.
MACD is signalling a down movement.
So, a new entry should be after the clear rebound.
Be careful with this stock!
ARAB has been falling badly. The pattern is showing a possibility for 2 rebound levels: 0.352 and 0.326Technical indicators:
RSI is near a BUY zone.
MACD is signalling a down movement.
So, a new entry should be after the clear rebound.
Be careful with this stock!

คำจำกัดสิทธิ์ความรับผิดชอบ
ข้อมูลและบทความไม่ได้มีวัตถุประสงค์เพื่อก่อให้เกิดกิจกรรมทางการเงิน, การลงทุน, การซื้อขาย, ข้อเสนอแนะ หรือคำแนะนำประเภทอื่น ๆ ที่ให้หรือรับรองโดย TradingView อ่านเพิ่มเติมใน ข้อกำหนดการใช้งาน
คำจำกัดสิทธิ์ความรับผิดชอบ
ข้อมูลและบทความไม่ได้มีวัตถุประสงค์เพื่อก่อให้เกิดกิจกรรมทางการเงิน, การลงทุน, การซื้อขาย, ข้อเสนอแนะ หรือคำแนะนำประเภทอื่น ๆ ที่ให้หรือรับรองโดย TradingView อ่านเพิ่มเติมใน ข้อกำหนดการใช้งาน