
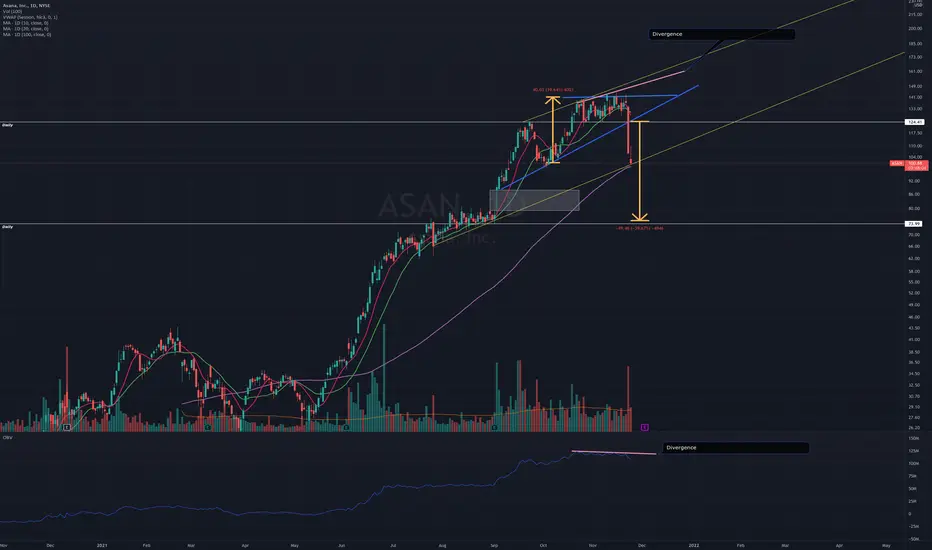
Bearish setup on daily chart. Let me know what you all see.
ASAN Short - Bearish setup
* MA 20/10 crossover
* Ascending triangle breakdown on high volume
* Bearish Divergence on OBV indicator
- Potential area to analyze
Break of trendline support which would also be a confluence area for MA100
Entry - Im thinking the closed below Trendline $98-99
Profit area - Test of gap or gap fill ($ 87 - 79) or implied move of pattern $74.
ASAN Short - Bearish setup
* MA 20/10 crossover
* Ascending triangle breakdown on high volume
* Bearish Divergence on OBV indicator
- Potential area to analyze
Break of trendline support which would also be a confluence area for MA100
Entry - Im thinking the closed below Trendline $98-99
Profit area - Test of gap or gap fill ($ 87 - 79) or implied move of pattern $74.

คำจำกัดสิทธิ์ความรับผิดชอบ
ข้อมูลและบทความไม่ได้มีวัตถุประสงค์เพื่อก่อให้เกิดกิจกรรมทางการเงิน, การลงทุน, การซื้อขาย, ข้อเสนอแนะ หรือคำแนะนำประเภทอื่น ๆ ที่ให้หรือรับรองโดย TradingView อ่านเพิ่มเติมใน ข้อกำหนดการใช้งาน
คำจำกัดสิทธิ์ความรับผิดชอบ
ข้อมูลและบทความไม่ได้มีวัตถุประสงค์เพื่อก่อให้เกิดกิจกรรมทางการเงิน, การลงทุน, การซื้อขาย, ข้อเสนอแนะ หรือคำแนะนำประเภทอื่น ๆ ที่ให้หรือรับรองโดย TradingView อ่านเพิ่มเติมใน ข้อกำหนดการใช้งาน