
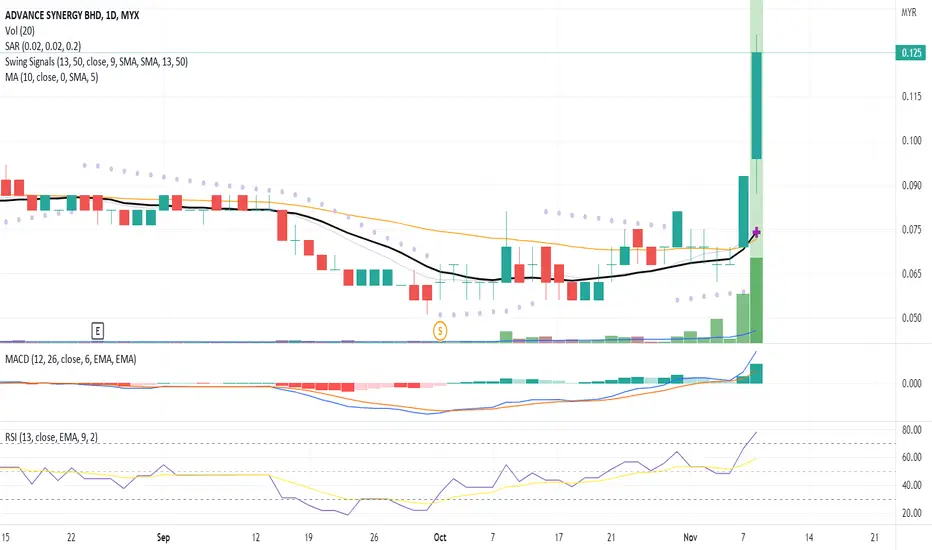
The candlestick indicates a breakout signal due to significant price movement backed by high volume with the price closed above the MA50 line.
The MACD signal is in a positive trend, hence, confirming the price uptrend toward the next price resistance.
The RSI cross-up of the indexer 70 indexer due to fresh buying interest on the stock making the candlestick in a breakout pattern.
Precaution for a price correction between 5%-10% from the recent peak before continuing with a price uptrend towards the next price resistance.
Let's save ASB in WL and watch out for significant price movement backed with volume toward the next price resistance.
R 0.195
S 0.080
The MACD signal is in a positive trend, hence, confirming the price uptrend toward the next price resistance.
The RSI cross-up of the indexer 70 indexer due to fresh buying interest on the stock making the candlestick in a breakout pattern.
Precaution for a price correction between 5%-10% from the recent peak before continuing with a price uptrend towards the next price resistance.
Let's save ASB in WL and watch out for significant price movement backed with volume toward the next price resistance.
R 0.195
S 0.080

คำจำกัดสิทธิ์ความรับผิดชอบ
ข้อมูลและบทความไม่ได้มีวัตถุประสงค์เพื่อก่อให้เกิดกิจกรรมทางการเงิน, การลงทุน, การซื้อขาย, ข้อเสนอแนะ หรือคำแนะนำประเภทอื่น ๆ ที่ให้หรือรับรองโดย TradingView อ่านเพิ่มเติมใน ข้อกำหนดการใช้งาน
คำจำกัดสิทธิ์ความรับผิดชอบ
ข้อมูลและบทความไม่ได้มีวัตถุประสงค์เพื่อก่อให้เกิดกิจกรรมทางการเงิน, การลงทุน, การซื้อขาย, ข้อเสนอแนะ หรือคำแนะนำประเภทอื่น ๆ ที่ให้หรือรับรองโดย TradingView อ่านเพิ่มเติมใน ข้อกำหนดการใช้งาน