
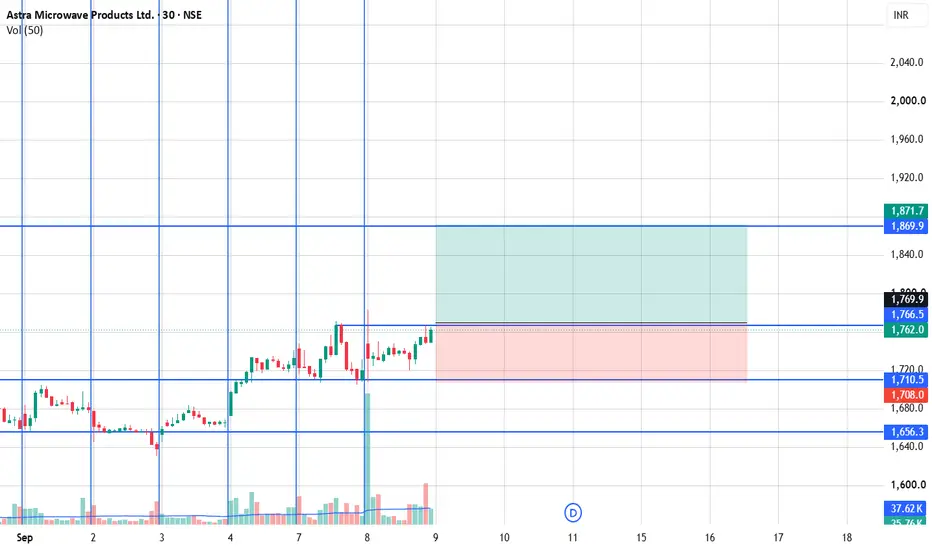
This is Astra Microwave – 30-minute chart. I’ll explain the Buy/Sell setup
Current situation on your chart
Current price is around ₹1,762, so it is sitting between ₹1,710 support and ₹1,870 resistance.
That means the chart is currently in a range, rather than giving a clean breakout/breakdown signal.
Simple rule:
Below ₹1,710 → bearish structure
₹1,710–₹1,870 → range / wait for confirmation
Above ₹1,870 → bullish breakout structure

คำจำกัดสิทธิ์ความรับผิดชอบ
ข้อมูลและบทความไม่ได้มีวัตถุประสงค์เพื่อก่อให้เกิดกิจกรรมทางการเงิน, การลงทุน, การซื้อขาย, ข้อเสนอแนะ หรือคำแนะนำประเภทอื่น ๆ ที่ให้หรือรับรองโดย TradingView อ่านเพิ่มเติมใน ข้อกำหนดการใช้งาน
คำจำกัดสิทธิ์ความรับผิดชอบ
ข้อมูลและบทความไม่ได้มีวัตถุประสงค์เพื่อก่อให้เกิดกิจกรรมทางการเงิน, การลงทุน, การซื้อขาย, ข้อเสนอแนะ หรือคำแนะนำประเภทอื่น ๆ ที่ให้หรือรับรองโดย TradingView อ่านเพิ่มเติมใน ข้อกำหนดการใช้งาน