
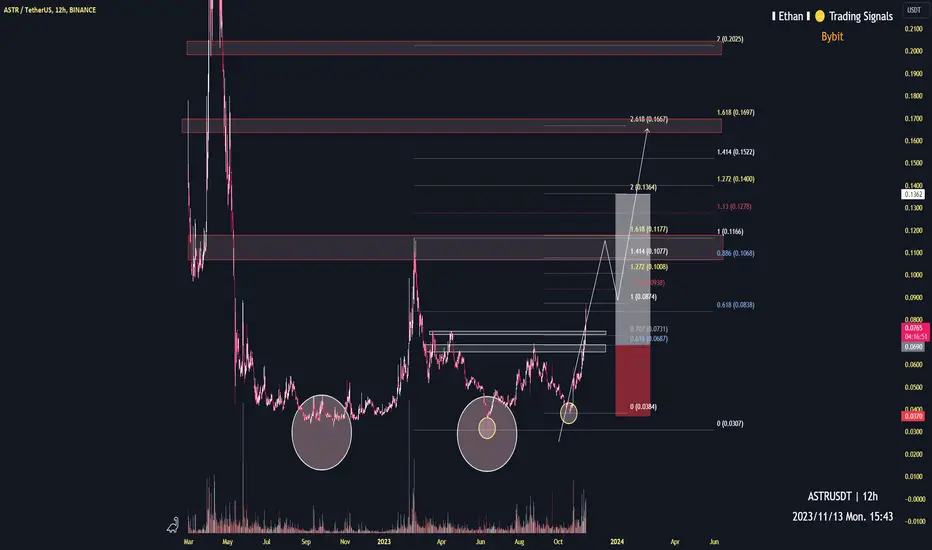
12h time frame
-
ASTR is creating two double bottoms, white and yellow circles which are marked on chart. This is a strong sign of bottom structure. Combining Fibonacci Projection with Structural resistance, we can have three targets as below. However, considering the potential dump of market, ASTR might reach 0.1~0.12 only then pull back with whole market, but we can still expect higher target when bull coming in 2024.
TP: 0.1~0.12 / 0.166 / 0.2
SL: 0.037

คำจำกัดสิทธิ์ความรับผิดชอบ
ข้อมูลและบทความไม่ได้มีวัตถุประสงค์เพื่อก่อให้เกิดกิจกรรมทางการเงิน, การลงทุน, การซื้อขาย, ข้อเสนอแนะ หรือคำแนะนำประเภทอื่น ๆ ที่ให้หรือรับรองโดย TradingView อ่านเพิ่มเติมใน ข้อกำหนดการใช้งาน
คำจำกัดสิทธิ์ความรับผิดชอบ
ข้อมูลและบทความไม่ได้มีวัตถุประสงค์เพื่อก่อให้เกิดกิจกรรมทางการเงิน, การลงทุน, การซื้อขาย, ข้อเสนอแนะ หรือคำแนะนำประเภทอื่น ๆ ที่ให้หรือรับรองโดย TradingView อ่านเพิ่มเติมใน ข้อกำหนดการใช้งาน