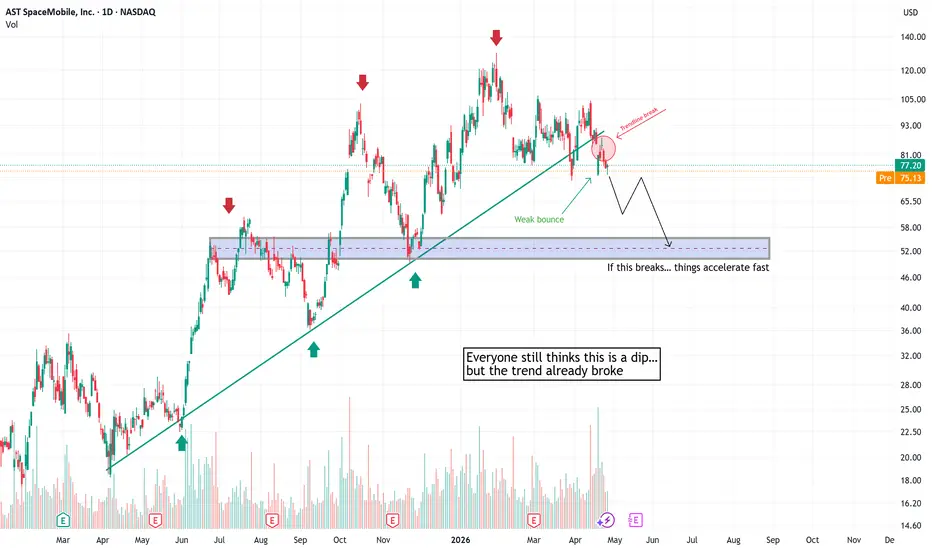
 ASTS built a strong uptrend for months, forming higher highs and higher lows. That structure conditions traders to buy every dip — because it keeps working… until it doesn’t.
Now we’re starting to see early signs of a shift.
The trendline has been broken, and the bounce that followed was weak — not the kind of reaction you expect in a healthy trend.
Trendline break
The first warning sign. It doesn’t confirm a reversal — but it tells you to pay attention.
2. The bounce
This is where you get information:
Strong bounce → trend may continue
Weak bounce → buyers are losing control
In this case: weak bounce
3. Key level test
Price returns to a major level (support/resistance).
This is where the real decision happens.
🎯 WHAT YOU CAN DO
Instead of guessing direction, you can react to levels:
Above 80 → bullish scenario
Structure recovers → potential continuation toward 90–100
Below 75 → bearish scenario
Acceptance below this level → move toward 52–55 becomes likely
👉 You’re not predicting — you’re waiting for confirmation.
WHY THIS MATTERS
Many traders treat this as “just another dip.”
But structurally, this is different:
trend broken
weak bounce
key level under pressure
That’s how trends quietly transition.
The market doesn’t usually tell you when a trend is over…
It shows you —in how price reacts after it breaks.
⚠️ DISCLAIMER
This is not financial advice.
Always manage your risk.

การนำเสนอที่เกี่ยวข้อง
คำจำกัดสิทธิ์ความรับผิดชอบ
ข้อมูลและบทความไม่ได้มีวัตถุประสงค์เพื่อก่อให้เกิดกิจกรรมทางการเงิน, การลงทุน, การซื้อขาย, ข้อเสนอแนะ หรือคำแนะนำประเภทอื่น ๆ ที่ให้หรือรับรองโดย TradingView อ่านเพิ่มเติมใน ข้อกำหนดการใช้งาน
การนำเสนอที่เกี่ยวข้อง
คำจำกัดสิทธิ์ความรับผิดชอบ
ข้อมูลและบทความไม่ได้มีวัตถุประสงค์เพื่อก่อให้เกิดกิจกรรมทางการเงิน, การลงทุน, การซื้อขาย, ข้อเสนอแนะ หรือคำแนะนำประเภทอื่น ๆ ที่ให้หรือรับรองโดย TradingView อ่านเพิ่มเติมใน ข้อกำหนดการใช้งาน