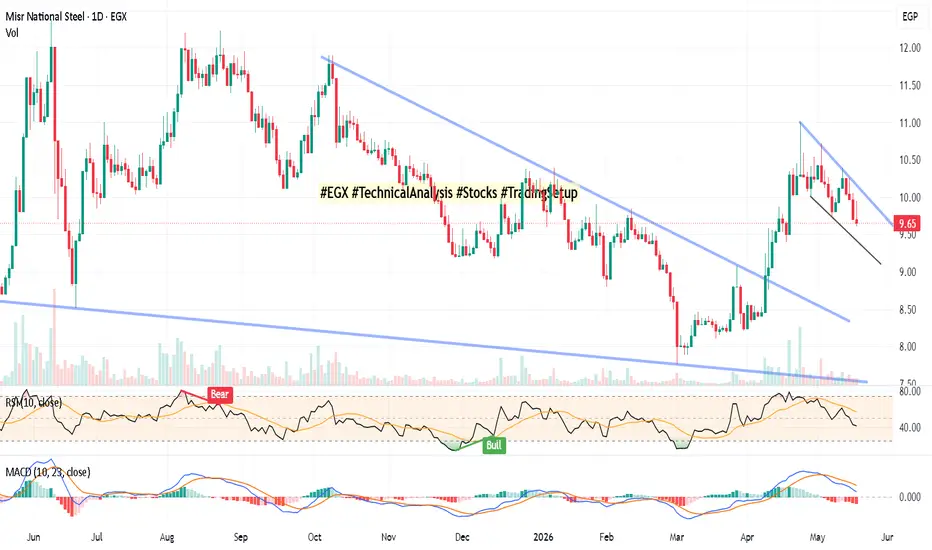
Daily Chart  ATQA
ATQA
On 19 May 2026; Close Price: 9.65
Key Technical Observations
Macro Breakout: ATQA has decisively broken above a massive, year-long descending channel that controlled the price since mid-2025. This shifts the primary trend bias from bearish to bullish.
Bull Flag/Wedge Formation: The current decline from the 11.00 EGP peak is a text-book corrective pullback (Bull Flag), taking place right above the broken macro resistance line.
Volume Confirmation: Volume surged significantly during the April breakout but has completely dried up during this recent drop. This proves the current pullback is low-pressure institutional absorption, not distribution.
Indicators Cooling Down: * RSI (10) has reset from overbought levels down to 41.46, hovering near key structural support (40).
MACD is showing a short-term bearish cross, but crucially remains above the zero line, defending the mid-term bullish regime.
-- Trading Strategy & Levels
The stock is currently sitting at a high-probability "Retest & Bounce" zone, offering an excellent risk-to-reward ratio.
Entry Zone: 9.50 – 9.65 EGP (Look for stabilization or a reversal candle on the daily chart).
Trigger: A daily close above the minor descending flag resistance (approx. 9.85 – 10.00 EGP).
Stop Loss (SL): Daily close below 9.40 EGP (Invalidation of the macro breakout).
Take Profit 1 (TP1): 11.00 EGP (Recent swing high).
Take Profit 2 (TP2): 11.75 – 12.00 EGP (Major long-term ascending purple resistance line).
What is your view on ATQA? Let me know in the comments!
ATQA On 19 May 2026; Close Price: 9.65
Key Technical Observations
Macro Breakout: ATQA has decisively broken above a massive, year-long descending channel that controlled the price since mid-2025. This shifts the primary trend bias from bearish to bullish.
Bull Flag/Wedge Formation: The current decline from the 11.00 EGP peak is a text-book corrective pullback (Bull Flag), taking place right above the broken macro resistance line.
Volume Confirmation: Volume surged significantly during the April breakout but has completely dried up during this recent drop. This proves the current pullback is low-pressure institutional absorption, not distribution.
Indicators Cooling Down: * RSI (10) has reset from overbought levels down to 41.46, hovering near key structural support (40).
MACD is showing a short-term bearish cross, but crucially remains above the zero line, defending the mid-term bullish regime.
-- Trading Strategy & Levels
The stock is currently sitting at a high-probability "Retest & Bounce" zone, offering an excellent risk-to-reward ratio.
Entry Zone: 9.50 – 9.65 EGP (Look for stabilization or a reversal candle on the daily chart).
Trigger: A daily close above the minor descending flag resistance (approx. 9.85 – 10.00 EGP).
Stop Loss (SL): Daily close below 9.40 EGP (Invalidation of the macro breakout).
Take Profit 1 (TP1): 11.00 EGP (Recent swing high).
Take Profit 2 (TP2): 11.75 – 12.00 EGP (Major long-term ascending purple resistance line).
What is your view on ATQA? Let me know in the comments!

คำจำกัดสิทธิ์ความรับผิดชอบ
ข้อมูลและบทความไม่ได้มีวัตถุประสงค์เพื่อก่อให้เกิดกิจกรรมทางการเงิน, การลงทุน, การซื้อขาย, ข้อเสนอแนะ หรือคำแนะนำประเภทอื่น ๆ ที่ให้หรือรับรองโดย TradingView อ่านเพิ่มเติมใน ข้อกำหนดการใช้งาน
คำจำกัดสิทธิ์ความรับผิดชอบ
ข้อมูลและบทความไม่ได้มีวัตถุประสงค์เพื่อก่อให้เกิดกิจกรรมทางการเงิน, การลงทุน, การซื้อขาย, ข้อเสนอแนะ หรือคำแนะนำประเภทอื่น ๆ ที่ให้หรือรับรองโดย TradingView อ่านเพิ่มเติมใน ข้อกำหนดการใช้งาน