

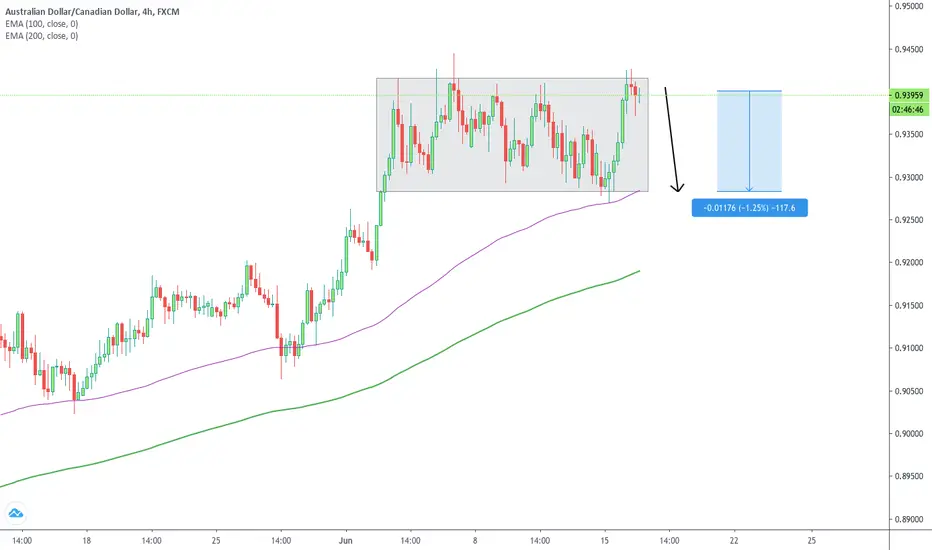
H4 analysis on AUDCAD shows price ranging between the 0.94000 - 0.93000 psychological levels since the beginning of the month.
Price action at the resistance area (long wicks, spinning tops/dojis) indicates price is struggling to break higher.
100+ pip drop potential, targeting the bottom of the range, in line with the 100 EMA where price may reject.
Price action at the resistance area (long wicks, spinning tops/dojis) indicates price is struggling to break higher.
100+ pip drop potential, targeting the bottom of the range, in line with the 100 EMA where price may reject.

คำจำกัดสิทธิ์ความรับผิดชอบ
ข้อมูลและบทความไม่ได้มีวัตถุประสงค์เพื่อก่อให้เกิดกิจกรรมทางการเงิน, การลงทุน, การซื้อขาย, ข้อเสนอแนะ หรือคำแนะนำประเภทอื่น ๆ ที่ให้หรือรับรองโดย TradingView อ่านเพิ่มเติมใน ข้อกำหนดการใช้งาน
คำจำกัดสิทธิ์ความรับผิดชอบ
ข้อมูลและบทความไม่ได้มีวัตถุประสงค์เพื่อก่อให้เกิดกิจกรรมทางการเงิน, การลงทุน, การซื้อขาย, ข้อเสนอแนะ หรือคำแนะนำประเภทอื่น ๆ ที่ให้หรือรับรองโดย TradingView อ่านเพิ่มเติมใน ข้อกำหนดการใช้งาน