

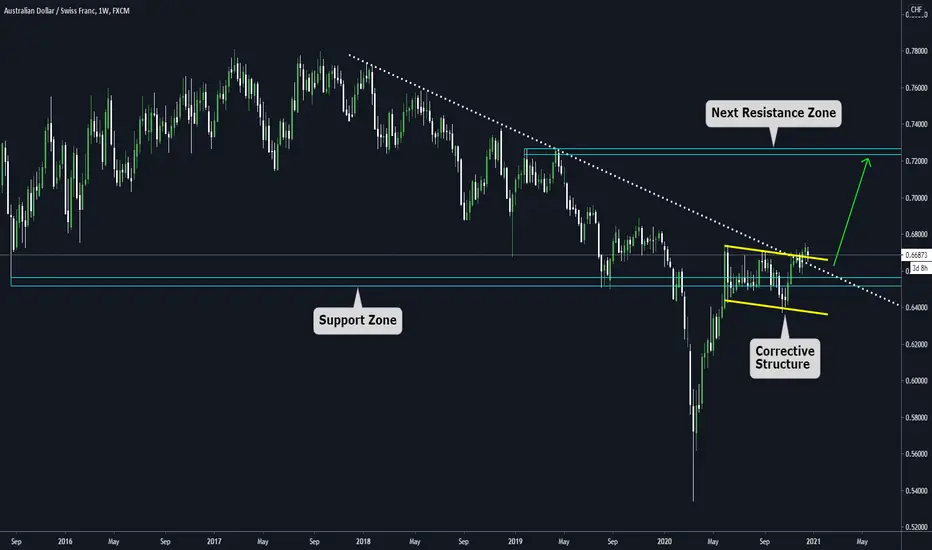
Let's take a look at the weekly chart on AUDCHF.
We have 3 relevant items to pay attention to
a) Broken descending trendline.
b) The price above a Huge support zone.
c) A massive Flag pattern on the edge of the broken descending trendline.
From a technical perspective, a Flag pattern is considered a continuation structure, which means that we have a sideways movement during a period of time, only for the price to keep going in the previous direction after the breakout.
We have 3 relevant items to pay attention to
a) Broken descending trendline.
b) The price above a Huge support zone.
c) A massive Flag pattern on the edge of the broken descending trendline.
From a technical perspective, a Flag pattern is considered a continuation structure, which means that we have a sideways movement during a period of time, only for the price to keep going in the previous direction after the breakout.

คำจำกัดสิทธิ์ความรับผิดชอบ
ข้อมูลและบทความไม่ได้มีวัตถุประสงค์เพื่อก่อให้เกิดกิจกรรมทางการเงิน, การลงทุน, การซื้อขาย, ข้อเสนอแนะ หรือคำแนะนำประเภทอื่น ๆ ที่ให้หรือรับรองโดย TradingView อ่านเพิ่มเติมใน ข้อกำหนดการใช้งาน
คำจำกัดสิทธิ์ความรับผิดชอบ
ข้อมูลและบทความไม่ได้มีวัตถุประสงค์เพื่อก่อให้เกิดกิจกรรมทางการเงิน, การลงทุน, การซื้อขาย, ข้อเสนอแนะ หรือคำแนะนำประเภทอื่น ๆ ที่ให้หรือรับรองโดย TradingView อ่านเพิ่มเติมใน ข้อกำหนดการใช้งาน