

H4 Chart Technical Analysis: Short
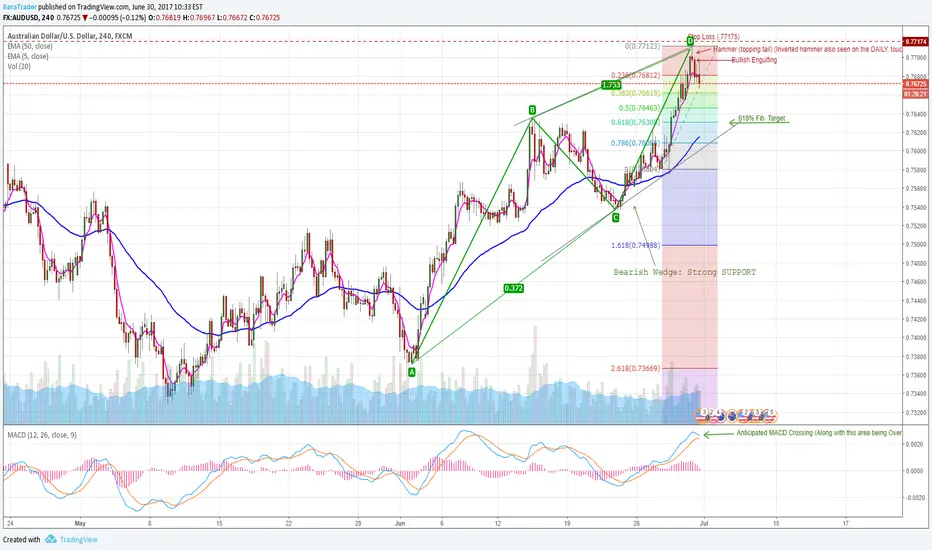
Candlestick analysis of a bullish real body followed by an inverted hammer/topping tail, to a bearish engulfing (of the bullish).
Alongside this we have the MACD's anticipated crossing over and Overbought RSI at the time of the inverted hammer.
My target is not necessarily to 'touch' the bullish trend line of support, but to retrace to the .618% fib. as a correction.
All of this contained within a bearish ABCD pattern.
Thanks Guys,
Kera
Candlestick analysis of a bullish real body followed by an inverted hammer/topping tail, to a bearish engulfing (of the bullish).
Alongside this we have the MACD's anticipated crossing over and Overbought RSI at the time of the inverted hammer.
My target is not necessarily to 'touch' the bullish trend line of support, but to retrace to the .618% fib. as a correction.
All of this contained within a bearish ABCD pattern.
Thanks Guys,
Kera

คำจำกัดสิทธิ์ความรับผิดชอบ
ข้อมูลและบทความไม่ได้มีวัตถุประสงค์เพื่อก่อให้เกิดกิจกรรมทางการเงิน, การลงทุน, การซื้อขาย, ข้อเสนอแนะ หรือคำแนะนำประเภทอื่น ๆ ที่ให้หรือรับรองโดย TradingView อ่านเพิ่มเติมใน ข้อกำหนดการใช้งาน
คำจำกัดสิทธิ์ความรับผิดชอบ
ข้อมูลและบทความไม่ได้มีวัตถุประสงค์เพื่อก่อให้เกิดกิจกรรมทางการเงิน, การลงทุน, การซื้อขาย, ข้อเสนอแนะ หรือคำแนะนำประเภทอื่น ๆ ที่ให้หรือรับรองโดย TradingView อ่านเพิ่มเติมใน ข้อกำหนดการใช้งาน