Market Analysis: AUD/USD Flash Early Signs of Bullish Recovery
Market Analysis: AUD/USD Flash Early Signs of Bullish Recovery
AUD/USD is attempting a fresh increase from 0.7015.
Important Takeaways for AUD/USD Analysis Today
- The Aussie Dollar remained supported above 0.7000 and recovered losses against the US Dollar.
- There was a break above a key declining channel with resistance at 0.7070 on the hourly chart of AUD/USD.
AUD/USD Technical Analysis
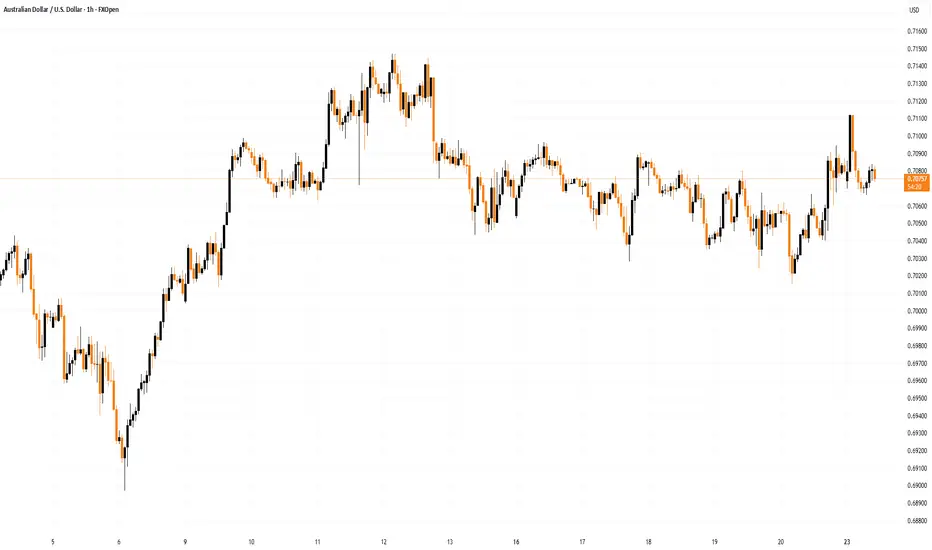
On the hourly chart of AUD/USD, the pair formed a base above 0.7000. The Aussie Dollar started a decent increase above 0.7035 against the US Dollar to enter a short-term positive zone.
There was a break above a key declining channel with resistance at 0.7070. The bulls even pushed the pair above the 61.8% Fib retracement level of the downward move from the 0.7147 swing high to the 0.7015 low and the 50-hour simple moving average.

The AUD/USD chart indicates that the pair could struggle to clear the 76.4% Fib retracement at 0.7115. The first major hurdle for the bulls could be 0.7150.
An upside break above 0.7150 might send the pair further higher. The next major target might be 0.7220. Any more gains could clear the path for a move toward 0.7300. If there is no close above 0.7115, the pair might start a fresh decline.
Immediate bid zone could be near 0.7065 and the 50-hour simple moving average. The next area of interest is 0.7035. If there is a downside break below 0.7035, the pair could extend its decline toward 0.7015. Any more losses might signal a move toward 0.6965.
This article represents the opinion of the Companies operating under the FXOpen brand only. It is not to be construed as an offer, solicitation, or recommendation with respect to products and services provided by the Companies operating under the FXOpen brand, nor is it to be considered financial advice.
AUD/USD is attempting a fresh increase from 0.7015.
Important Takeaways for AUD/USD Analysis Today
- The Aussie Dollar remained supported above 0.7000 and recovered losses against the US Dollar.
- There was a break above a key declining channel with resistance at 0.7070 on the hourly chart of AUD/USD.
AUD/USD Technical Analysis
On the hourly chart of AUD/USD, the pair formed a base above 0.7000. The Aussie Dollar started a decent increase above 0.7035 against the US Dollar to enter a short-term positive zone.
There was a break above a key declining channel with resistance at 0.7070. The bulls even pushed the pair above the 61.8% Fib retracement level of the downward move from the 0.7147 swing high to the 0.7015 low and the 50-hour simple moving average.
The AUD/USD chart indicates that the pair could struggle to clear the 76.4% Fib retracement at 0.7115. The first major hurdle for the bulls could be 0.7150.
An upside break above 0.7150 might send the pair further higher. The next major target might be 0.7220. Any more gains could clear the path for a move toward 0.7300. If there is no close above 0.7115, the pair might start a fresh decline.
Immediate bid zone could be near 0.7065 and the 50-hour simple moving average. The next area of interest is 0.7035. If there is a downside break below 0.7035, the pair could extend its decline toward 0.7015. Any more losses might signal a move toward 0.6965.
This article represents the opinion of the Companies operating under the FXOpen brand only. It is not to be construed as an offer, solicitation, or recommendation with respect to products and services provided by the Companies operating under the FXOpen brand, nor is it to be considered financial advice.

คำจำกัดสิทธิ์ความรับผิดชอบ
ข้อมูลและบทความไม่ได้มีวัตถุประสงค์เพื่อก่อให้เกิดกิจกรรมทางการเงิน, การลงทุน, การซื้อขาย, ข้อเสนอแนะ หรือคำแนะนำประเภทอื่น ๆ ที่ให้หรือรับรองโดย TradingView อ่านเพิ่มเติมใน ข้อกำหนดการใช้งาน
คำจำกัดสิทธิ์ความรับผิดชอบ
ข้อมูลและบทความไม่ได้มีวัตถุประสงค์เพื่อก่อให้เกิดกิจกรรมทางการเงิน, การลงทุน, การซื้อขาย, ข้อเสนอแนะ หรือคำแนะนำประเภทอื่น ๆ ที่ให้หรือรับรองโดย TradingView อ่านเพิ่มเติมใน ข้อกำหนดการใช้งาน