

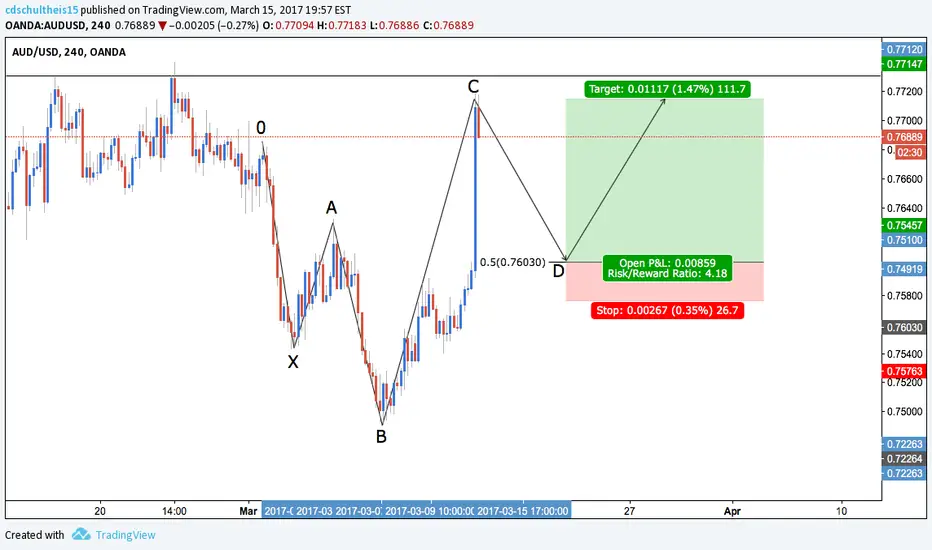
Here we have a bullish 5-0 on the 4H chart with the AUD/USD.
After the big jump to C point, we can look to watch price retrace from the resistance zone and make its way down to D point.
For even further confirmation, we are seeing the Golden Ratio 1.618 appear twice at B and C point.
The measurements for a valid 5-0 pattern are detailed below.
B: 1.13 - 1.618
C: 1.618 - 2.24
D: 0.50
After the big jump to C point, we can look to watch price retrace from the resistance zone and make its way down to D point.
For even further confirmation, we are seeing the Golden Ratio 1.618 appear twice at B and C point.
The measurements for a valid 5-0 pattern are detailed below.
B: 1.13 - 1.618
C: 1.618 - 2.24
D: 0.50

การนำเสนอที่เกี่ยวข้อง
คำจำกัดสิทธิ์ความรับผิดชอบ
ข้อมูลและบทความไม่ได้มีวัตถุประสงค์เพื่อก่อให้เกิดกิจกรรมทางการเงิน, การลงทุน, การซื้อขาย, ข้อเสนอแนะ หรือคำแนะนำประเภทอื่น ๆ ที่ให้หรือรับรองโดย TradingView อ่านเพิ่มเติมใน ข้อกำหนดการใช้งาน
การนำเสนอที่เกี่ยวข้อง
คำจำกัดสิทธิ์ความรับผิดชอบ
ข้อมูลและบทความไม่ได้มีวัตถุประสงค์เพื่อก่อให้เกิดกิจกรรมทางการเงิน, การลงทุน, การซื้อขาย, ข้อเสนอแนะ หรือคำแนะนำประเภทอื่น ๆ ที่ให้หรือรับรองโดย TradingView อ่านเพิ่มเติมใน ข้อกำหนดการใช้งาน