
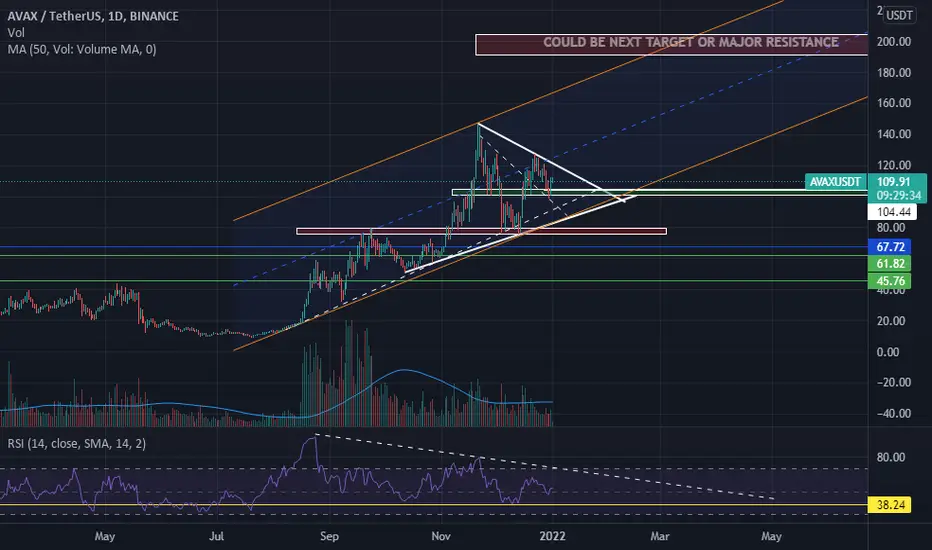
I am sharing AAVAX/USDT's support, Resistance, and possible long-term targets.
As you can see price is maintaining its upside movement in an upside Parallel channel on a daily timeframe.
Plus there is a symmetrical triangle on the price chart which is bullish and if I measure the size and see the possible target is the same as Fib 1.618.
Also if you see RSI bouncing again and again from the yellow line I have marked on it. As it is working as support.
NOTE: #DYOR
As you can see price is maintaining its upside movement in an upside Parallel channel on a daily timeframe.
Plus there is a symmetrical triangle on the price chart which is bullish and if I measure the size and see the possible target is the same as Fib 1.618.
Also if you see RSI bouncing again and again from the yellow line I have marked on it. As it is working as support.
NOTE: #DYOR

คำจำกัดสิทธิ์ความรับผิดชอบ
ข้อมูลและบทความไม่ได้มีวัตถุประสงค์เพื่อก่อให้เกิดกิจกรรมทางการเงิน, การลงทุน, การซื้อขาย, ข้อเสนอแนะ หรือคำแนะนำประเภทอื่น ๆ ที่ให้หรือรับรองโดย TradingView อ่านเพิ่มเติมใน ข้อกำหนดการใช้งาน
คำจำกัดสิทธิ์ความรับผิดชอบ
ข้อมูลและบทความไม่ได้มีวัตถุประสงค์เพื่อก่อให้เกิดกิจกรรมทางการเงิน, การลงทุน, การซื้อขาย, ข้อเสนอแนะ หรือคำแนะนำประเภทอื่น ๆ ที่ให้หรือรับรองโดย TradingView อ่านเพิ่มเติมใน ข้อกำหนดการใช้งาน