
AZLCZ (1W): Parabolic Run Testing Channel Extremes – Overextended or Just Getting Started
Market Overview
Technical Analysis
1. Parabolic Channel Mechanics
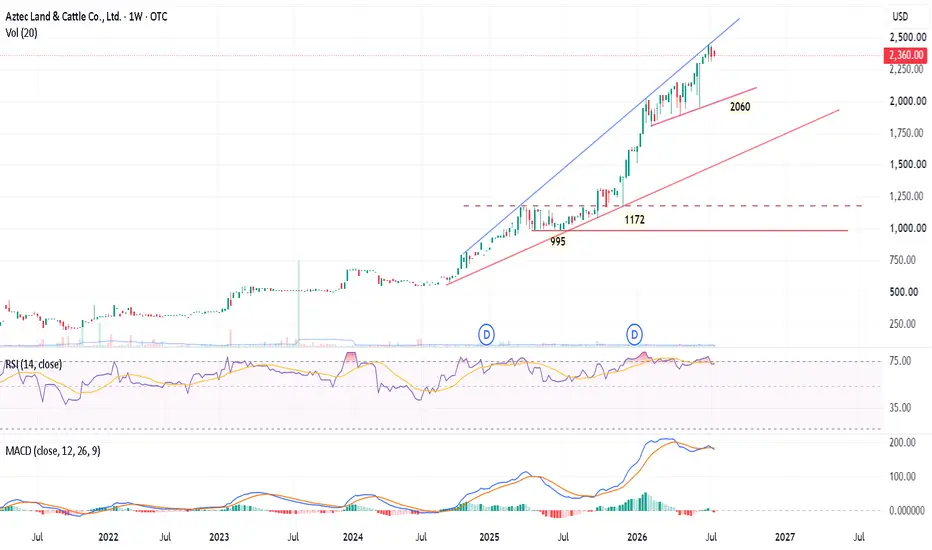
AZLCZ has experienced an aggressive, high-momentum advance on the weekly frame. Price action is currently riding the absolute upper limit of an steep ascending channel (marked by the solid blue line). This steep trajectory reflects intense buying pressure, but it also places the asset into deep overextended territory relative to its historical baselines.
2. Key Support Structural Levels
Should the current multi-week rally pause or face a corrective pullback, multiple solid support baselines are mapped out below:
3. Technical Indicators & Volume Profile
Trading Strategy & Risk Management
The Aggressive Long/Hold Plan
___________________
This is a text-book definition of a low-volume macro squeeze. Are you holding out for a blow-off top past 2,500, or is it time to take chips off the table at the top of the channel? Let me know your game plan in the comments below!
Market Overview
- Ticker: Aztec Land & Cattle Co., Ltd. (AZLCZ)
- Timeframe: 1-Week (1W)
- Current Price: 2,360.00
- Sentiment: Exceptionally Bullish (With High Risk of Momentum Exhaustion)
Technical Analysis
1. Parabolic Channel Mechanics
AZLCZ has experienced an aggressive, high-momentum advance on the weekly frame. Price action is currently riding the absolute upper limit of an steep ascending channel (marked by the solid blue line). This steep trajectory reflects intense buying pressure, but it also places the asset into deep overextended territory relative to its historical baselines.
2. Key Support Structural Levels
Should the current multi-week rally pause or face a corrective pullback, multiple solid support baselines are mapped out below:
- Immediate Channel Support: The short-term rising support line (magenta) currently flags an structural cushion near 2,060.
- Major Historical Pivot Floor: The primary long-term ascending trendline (red) intersects with historical congestion points around 1,172 and the previous macro swing low near 995.
3. Technical Indicators & Volume Profile
- Volume: Crucially, the volume bars accompanying the recent push up toward 2,360 are extremely thin (noted at a Vol of 54). This severe volume-price divergence signals that the asset is highly illiquid on the OTC market, meaning very small order flow can cause drastic price swings.
- RSI (14): Currently printing at 71.56, hovering inside overbought territory but slightly ticking down from its yellow moving average line (73.17). This indicates a subtle loss of immediate velocity despite the high price print.
- MACD (12, 26, 9): Both the MACD line (179.03) and the Signal line (183.00) remain highly elevated above the zero line, confirming a strong macro-bullish regime. However, the histogram has compressed to near-neutral (-3.97), flashing a potential bearish crossover if consolidation turns into a sell-off.
Trading Strategy & Risk Management
The Aggressive Long/Hold Plan
- Strategy: Given the illiquid nature and parabolic structure, entering fresh longs at the absolute top of the channel presents an unfavorable risk-to-reward ratio. Existing positions can trail stops tightly.
- Upside Target: If momentum can cleanly break out above the blue line, psychological extensions push toward 2,500+ .
- Trailing Stop Area: A weekly close below 2,060 serves as the initial warning sign to lock in profits, risking a deeper slide back toward the macro trendlines.
___________________
This is a text-book definition of a low-volume macro squeeze. Are you holding out for a blow-off top past 2,500, or is it time to take chips off the table at the top of the channel? Let me know your game plan in the comments below!

คำจำกัดสิทธิ์ความรับผิดชอบ
ข้อมูลและบทความไม่ได้มีวัตถุประสงค์เพื่อก่อให้เกิดกิจกรรมทางการเงิน, การลงทุน, การซื้อขาย, ข้อเสนอแนะ หรือคำแนะนำประเภทอื่น ๆ ที่ให้หรือรับรองโดย TradingView อ่านเพิ่มเติมใน ข้อกำหนดการใช้งาน
คำจำกัดสิทธิ์ความรับผิดชอบ
ข้อมูลและบทความไม่ได้มีวัตถุประสงค์เพื่อก่อให้เกิดกิจกรรมทางการเงิน, การลงทุน, การซื้อขาย, ข้อเสนอแนะ หรือคำแนะนำประเภทอื่น ๆ ที่ให้หรือรับรองโดย TradingView อ่านเพิ่มเติมใน ข้อกำหนดการใช้งาน