
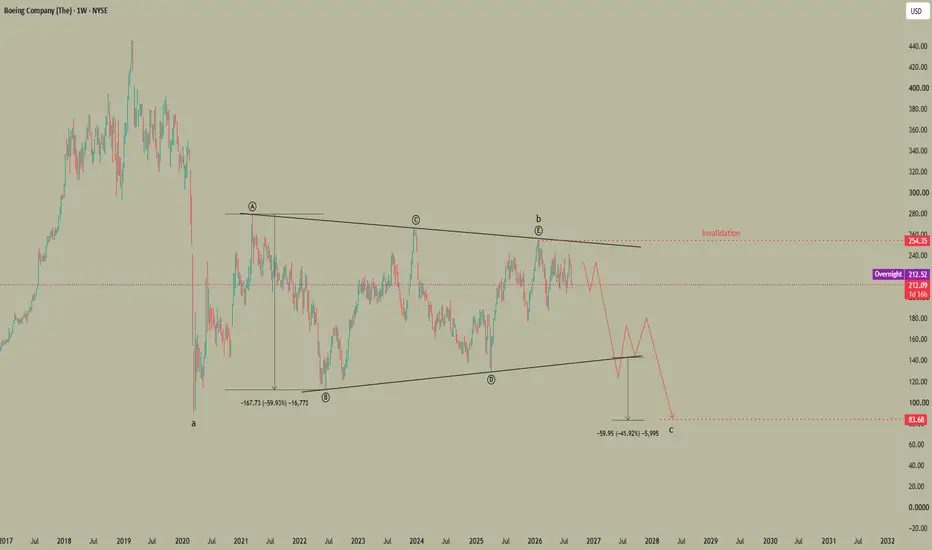
Boeing has been painting a pretty clear symmetrical triangle pattern between 2020 and 2026 which could be ABCDE waves for wave B.
Triangles formed after a bear trend tend to lead to a continuation of the bear trend so could expect the triangle lower trendline to be tested and broken in the future to complete wave C.
Invalidation would be a break above wave E at $254.
You can use Bulkowskis method for calculating targets for triangle breakouts:
thepatternsite.com/st.html
Compute the height from the highest peak to the lowest valley in the triangle pattern then multiply it by 36%. Add it (upward breakouts) or subtract it (downward breakouts) from the breakout price; that puts a target around $84 (depending exactly where the triangle breaks on the downside).
Triangles formed after a bear trend tend to lead to a continuation of the bear trend so could expect the triangle lower trendline to be tested and broken in the future to complete wave C.
Invalidation would be a break above wave E at $254.
You can use Bulkowskis method for calculating targets for triangle breakouts:
thepatternsite.com/st.html
Compute the height from the highest peak to the lowest valley in the triangle pattern then multiply it by 36%. Add it (upward breakouts) or subtract it (downward breakouts) from the breakout price; that puts a target around $84 (depending exactly where the triangle breaks on the downside).

คำจำกัดสิทธิ์ความรับผิดชอบ
ข้อมูลและบทความไม่ได้มีวัตถุประสงค์เพื่อก่อให้เกิดกิจกรรมทางการเงิน, การลงทุน, การซื้อขาย, ข้อเสนอแนะ หรือคำแนะนำประเภทอื่น ๆ ที่ให้หรือรับรองโดย TradingView อ่านเพิ่มเติมใน ข้อกำหนดการใช้งาน
คำจำกัดสิทธิ์ความรับผิดชอบ
ข้อมูลและบทความไม่ได้มีวัตถุประสงค์เพื่อก่อให้เกิดกิจกรรมทางการเงิน, การลงทุน, การซื้อขาย, ข้อเสนอแนะ หรือคำแนะนำประเภทอื่น ๆ ที่ให้หรือรับรองโดย TradingView อ่านเพิ่มเติมใน ข้อกำหนดการใช้งาน