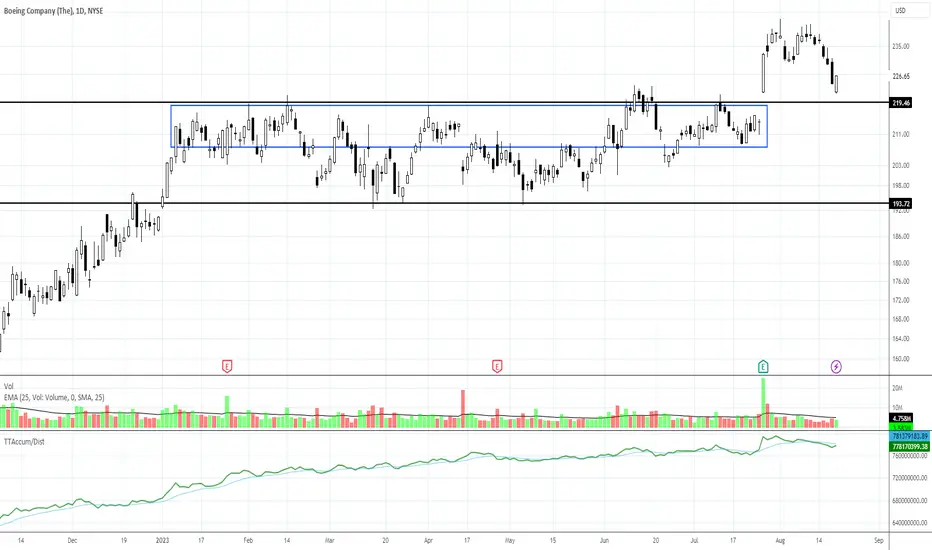
The Daily Chart of  BA shows where the probable support will halt the selling for Boeing.
The long sideways trend is close to being a platform. The highs, or within the highs of the range, should provide strong support for the stock.
If it dips deeper, it is likely to be temporary and should shift back to the higher area of the sideways trend.
BA shows where the probable support will halt the selling for Boeing. The long sideways trend is close to being a platform. The highs, or within the highs of the range, should provide strong support for the stock.
If it dips deeper, it is likely to be temporary and should shift back to the higher area of the sideways trend.

Martha Stokes, CMT
Chartered Market Technician
Co-founder, CEO & Head Instructor at TechniTrader
Learn more at the TechniTrader Learning Center: ttrader.im/learning-center
Chartered Market Technician
Co-founder, CEO & Head Instructor at TechniTrader
Learn more at the TechniTrader Learning Center: ttrader.im/learning-center
คำจำกัดสิทธิ์ความรับผิดชอบ
ข้อมูลและบทความไม่ได้มีวัตถุประสงค์เพื่อก่อให้เกิดกิจกรรมทางการเงิน, การลงทุน, การซื้อขาย, ข้อเสนอแนะ หรือคำแนะนำประเภทอื่น ๆ ที่ให้หรือรับรองโดย TradingView อ่านเพิ่มเติมใน ข้อกำหนดการใช้งาน