
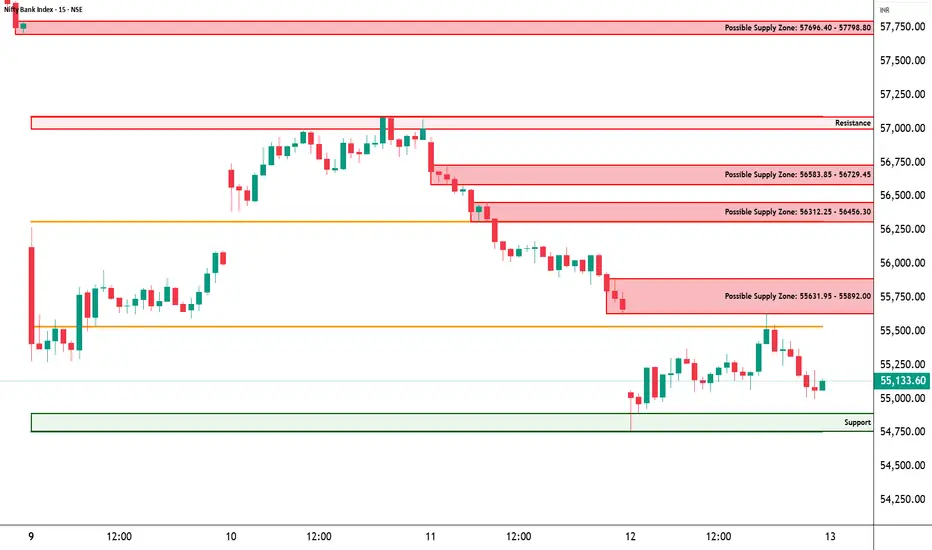
📊 Bank Nifty Analysis for 13 March 2026 (Simple Chart Reading)
CMP: 55,100
Current Structure: Downtrend on daily timeframe
Market Mood: Bearish structure with expanding volatility
Bank Nifty continues to trade within a declining structure after facing rejection from the higher supply region. The broader price action reflects a sequence of lower highs and lower lows, indicating sustained selling pressure across the banking index. The recent sharp downside candles suggest that institutional participants have been reducing exposure, while the market is currently attempting to stabilize after the rapid decline.
Immediate resistance levels are placed near 55,571, followed by 56,042 and 56,448, where earlier supply zones remain active. These areas correspond with previous breakdown regions and may attract selling pressure if price attempts a recovery move.
On the downside, immediate support levels are positioned near 54,695, followed by 54,289 and 53,818, where earlier buying reactions were visible. The visible swing support zone around 54,760 remains an important structural level where buyers may attempt stabilization if selling pressure continues.
The projected CPR for the next session appears narrow and positioned slightly lower, which typically suggests the potential for a trending session if price decisively moves away from the CPR zone. If price sustains below the CPR region during the early phase of the session, selling pressure may remain dominant toward lower support zones. However, if price manages to reclaim the CPR region, a recovery toward nearby resistance zones may develop. Overall, the CPR region is likely to act as the decision zone for the session.
For the upcoming session, the expected gap opening range is approximately 550–600 points, considering the recent volatility expansion and statistical positioning of the index.
If the market opens with a gap up, price may initially test resistance near 55,571. Sustaining above this region may allow a move toward 56,042, while stronger supply may appear near 56,448.
If the market opens with a gap down, price may first test support near 54,695. Continued weakness could extend toward 54,289 and possibly toward 53,818, where deeper demand reactions may appear.
In a sideways scenario, price may oscillate between 54,695 and 55,571, while a wider intraday range could develop between 54,289 and 56,042 if volatility expands.
From a broader observation perspective, downside observation zones appear near 54,500, followed by 54,000 and 53,500, where deeper structural demand reactions may develop. On the upside, if price regains strength and sustains above resistance clusters, observation zones may appear near 56,000, 56,500, and 57,000, where supply participation may emerge again.
STWP Option Chain Analysis
Here is a quick options-based observation for BANKNIFTY (30 March 2026).
From the current options activity, an important support area is visible near 54,700, while resistance appears around 55,500. Most liquidity is currently concentrated near 55,100, which often becomes an area where price spends time during the session.
Call-side positioning is building around 55,500, while put-side liquidity is visible near 54,700. Another level worth watching is 55,600, where price may slow down or react due to hedging activity.
Based on the current option structure, the visible positioning band appears to be between 54,700 and 55,500, creating an approximate range width of about 800 points. Using this structure as a reference, the estimated intraday movement expectation is roughly around ±320 points from the ATM level.
This places the approximate upper activity zone near 55,420, while the lower activity zone appears near 54,780.
Options pressure currently shows Call Pressure near 65% and Put Pressure near 35%, indicating that call-side positioning is slightly stronger, which may create overhead resistance pressure.
Institutional Build-Up Signal:
Build-Up Signal: Short Build-up
Key Liquidity Strikes:
Best CE Liquidity Strike: 55,000
Best PE Liquidity Strike: 55,000
Liquidity Vacuum Observation:
Liquidity Vacuum Zone: 54,800 (price may move faster through this level)
Current positioning does not indicate a strong dealer trap structure.
If price manages to move above 55,600, it may indicate strengthening momentum on the upside. On the other hand, if price moves below 54,600, downside pressure may begin to increase.
Overall, the current options structure suggests that price may continue rotating between 54,700 and 55,500, with 55,100 acting as a short-term liquidity magnet while market participants continue adjusting their positions.
⚠️ Important Note
This information is shared strictly for educational and analytical purposes based on publicly available options chain data.
It is not investment advice, not a trading recommendation, and not a buy or sell signal.
Please consult a SEBI-registered financial advisor before making any trading or investment decisions.
— STWP 📊
CMP: 55,100
Current Structure: Downtrend on daily timeframe
Market Mood: Bearish structure with expanding volatility
Bank Nifty continues to trade within a declining structure after facing rejection from the higher supply region. The broader price action reflects a sequence of lower highs and lower lows, indicating sustained selling pressure across the banking index. The recent sharp downside candles suggest that institutional participants have been reducing exposure, while the market is currently attempting to stabilize after the rapid decline.
Immediate resistance levels are placed near 55,571, followed by 56,042 and 56,448, where earlier supply zones remain active. These areas correspond with previous breakdown regions and may attract selling pressure if price attempts a recovery move.
On the downside, immediate support levels are positioned near 54,695, followed by 54,289 and 53,818, where earlier buying reactions were visible. The visible swing support zone around 54,760 remains an important structural level where buyers may attempt stabilization if selling pressure continues.
The projected CPR for the next session appears narrow and positioned slightly lower, which typically suggests the potential for a trending session if price decisively moves away from the CPR zone. If price sustains below the CPR region during the early phase of the session, selling pressure may remain dominant toward lower support zones. However, if price manages to reclaim the CPR region, a recovery toward nearby resistance zones may develop. Overall, the CPR region is likely to act as the decision zone for the session.
For the upcoming session, the expected gap opening range is approximately 550–600 points, considering the recent volatility expansion and statistical positioning of the index.
If the market opens with a gap up, price may initially test resistance near 55,571. Sustaining above this region may allow a move toward 56,042, while stronger supply may appear near 56,448.
If the market opens with a gap down, price may first test support near 54,695. Continued weakness could extend toward 54,289 and possibly toward 53,818, where deeper demand reactions may appear.
In a sideways scenario, price may oscillate between 54,695 and 55,571, while a wider intraday range could develop between 54,289 and 56,042 if volatility expands.
From a broader observation perspective, downside observation zones appear near 54,500, followed by 54,000 and 53,500, where deeper structural demand reactions may develop. On the upside, if price regains strength and sustains above resistance clusters, observation zones may appear near 56,000, 56,500, and 57,000, where supply participation may emerge again.
STWP Option Chain Analysis
Here is a quick options-based observation for BANKNIFTY (30 March 2026).
From the current options activity, an important support area is visible near 54,700, while resistance appears around 55,500. Most liquidity is currently concentrated near 55,100, which often becomes an area where price spends time during the session.
Call-side positioning is building around 55,500, while put-side liquidity is visible near 54,700. Another level worth watching is 55,600, where price may slow down or react due to hedging activity.
Based on the current option structure, the visible positioning band appears to be between 54,700 and 55,500, creating an approximate range width of about 800 points. Using this structure as a reference, the estimated intraday movement expectation is roughly around ±320 points from the ATM level.
This places the approximate upper activity zone near 55,420, while the lower activity zone appears near 54,780.
Options pressure currently shows Call Pressure near 65% and Put Pressure near 35%, indicating that call-side positioning is slightly stronger, which may create overhead resistance pressure.
Institutional Build-Up Signal:
Build-Up Signal: Short Build-up
Key Liquidity Strikes:
Best CE Liquidity Strike: 55,000
Best PE Liquidity Strike: 55,000
Liquidity Vacuum Observation:
Liquidity Vacuum Zone: 54,800 (price may move faster through this level)
Current positioning does not indicate a strong dealer trap structure.
If price manages to move above 55,600, it may indicate strengthening momentum on the upside. On the other hand, if price moves below 54,600, downside pressure may begin to increase.
Overall, the current options structure suggests that price may continue rotating between 54,700 and 55,500, with 55,100 acting as a short-term liquidity magnet while market participants continue adjusting their positions.
⚠️ Important Note
This information is shared strictly for educational and analytical purposes based on publicly available options chain data.
It is not investment advice, not a trading recommendation, and not a buy or sell signal.
Please consult a SEBI-registered financial advisor before making any trading or investment decisions.
— STWP 📊

STWP | Mentor & Demand-Supply Specialist |
Empowering traders through structured learning |
simpletradewithpatience.com
Community: chat.whatsapp.com/BEYz0tkqP0fJPBCWf59uel
wa.me/message/6IOPHGOXMGZ4N1
Educational Only
Empowering traders through structured learning |
simpletradewithpatience.com
Community: chat.whatsapp.com/BEYz0tkqP0fJPBCWf59uel
wa.me/message/6IOPHGOXMGZ4N1
Educational Only
คำจำกัดสิทธิ์ความรับผิดชอบ
ข้อมูลและบทความไม่ได้มีวัตถุประสงค์เพื่อก่อให้เกิดกิจกรรมทางการเงิน, การลงทุน, การซื้อขาย, ข้อเสนอแนะ หรือคำแนะนำประเภทอื่น ๆ ที่ให้หรือรับรองโดย TradingView อ่านเพิ่มเติมใน ข้อกำหนดการใช้งาน
STWP | Mentor & Demand-Supply Specialist |
Empowering traders through structured learning |
simpletradewithpatience.com
Community: chat.whatsapp.com/BEYz0tkqP0fJPBCWf59uel
wa.me/message/6IOPHGOXMGZ4N1
Educational Only
Empowering traders through structured learning |
simpletradewithpatience.com
Community: chat.whatsapp.com/BEYz0tkqP0fJPBCWf59uel
wa.me/message/6IOPHGOXMGZ4N1
Educational Only
คำจำกัดสิทธิ์ความรับผิดชอบ
ข้อมูลและบทความไม่ได้มีวัตถุประสงค์เพื่อก่อให้เกิดกิจกรรมทางการเงิน, การลงทุน, การซื้อขาย, ข้อเสนอแนะ หรือคำแนะนำประเภทอื่น ๆ ที่ให้หรือรับรองโดย TradingView อ่านเพิ่มเติมใน ข้อกำหนดการใช้งาน