
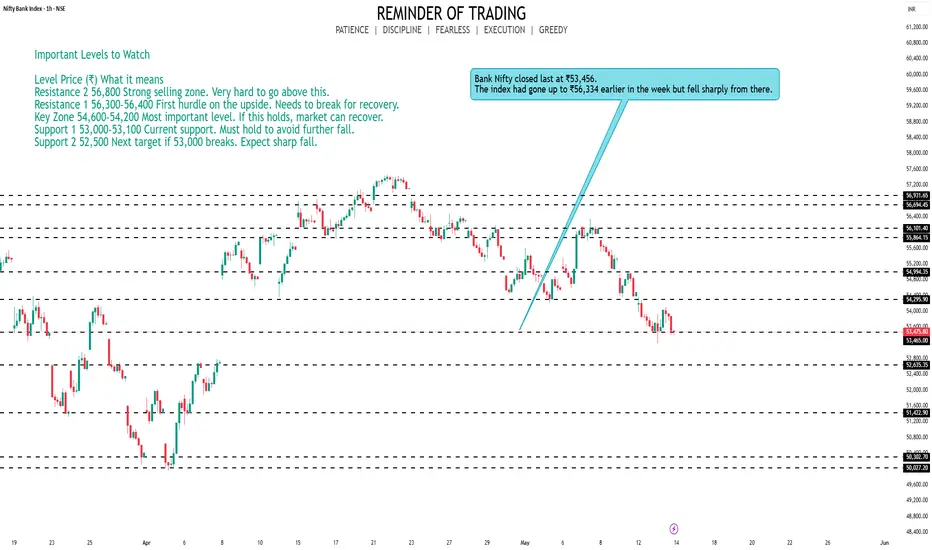
Bank Nifty closed last at ₹53,456.
The index had gone up to ₹56,334 earlier in the week but fell sharply from there. It could not hold above the important 20-week average level, which means sellers are still in control.
The index also broke below its 20-day and 50-day averages on the daily chart — which is a sign of weakness in the short term.
Important Levels to Watch
Level Price (₹) What it means
Resistance 2 56,800 Strong selling zone. Very hard to go above this.
Resistance 1 56,300–56,400 First hurdle on the upside. Needs to break for recovery.
Key Zone 54,600–54,200 Most important level. If this holds, market can recover.
Support 1 53,000–53,100 Current support. Must hold to avoid further fall.
Support 2 52,500 Next target if 53,000 breaks. Expect sharp fall.
What Can Happen Next Week?
If market goes UP:
• Bank Nifty needs to first cross and stay above 54,600
• After that, it can move toward 55,400 and then 56,000–56,400
• Only a strong close above 56,400 will change the trend to bullish
If market goes DOWN:
• If it breaks below 53,000 and closes there, expect a fall to 52,500
• Below 52,500, the next support is around 51,800
• Avoid fresh buying in banking stocks until 54,000 is reclaimed
The index had gone up to ₹56,334 earlier in the week but fell sharply from there. It could not hold above the important 20-week average level, which means sellers are still in control.
The index also broke below its 20-day and 50-day averages on the daily chart — which is a sign of weakness in the short term.
Important Levels to Watch
Level Price (₹) What it means
Resistance 2 56,800 Strong selling zone. Very hard to go above this.
Resistance 1 56,300–56,400 First hurdle on the upside. Needs to break for recovery.
Key Zone 54,600–54,200 Most important level. If this holds, market can recover.
Support 1 53,000–53,100 Current support. Must hold to avoid further fall.
Support 2 52,500 Next target if 53,000 breaks. Expect sharp fall.
What Can Happen Next Week?
If market goes UP:
• Bank Nifty needs to first cross and stay above 54,600
• After that, it can move toward 55,400 and then 56,000–56,400
• Only a strong close above 56,400 will change the trend to bullish
If market goes DOWN:
• If it breaks below 53,000 and closes there, expect a fall to 52,500
• Below 52,500, the next support is around 51,800
• Avoid fresh buying in banking stocks until 54,000 is reclaimed

Hye Guys,Welcome to a professional trading journey built on precision, discipline, and smart money concepts.
📞 Phone: +91 93159 78955
💬 WhatsApp: wa.link/kdkejz
📩 Contact Mail: globalwolfstreet@gmail.com
📞 Phone: +91 93159 78955
💬 WhatsApp: wa.link/kdkejz
📩 Contact Mail: globalwolfstreet@gmail.com
การนำเสนอที่เกี่ยวข้อง
คำจำกัดสิทธิ์ความรับผิดชอบ
ข้อมูลและบทความไม่ได้มีวัตถุประสงค์เพื่อก่อให้เกิดกิจกรรมทางการเงิน, การลงทุน, การซื้อขาย, ข้อเสนอแนะ หรือคำแนะนำประเภทอื่น ๆ ที่ให้หรือรับรองโดย TradingView อ่านเพิ่มเติมใน ข้อกำหนดการใช้งาน
Hye Guys,Welcome to a professional trading journey built on precision, discipline, and smart money concepts.
📞 Phone: +91 93159 78955
💬 WhatsApp: wa.link/kdkejz
📩 Contact Mail: globalwolfstreet@gmail.com
📞 Phone: +91 93159 78955
💬 WhatsApp: wa.link/kdkejz
📩 Contact Mail: globalwolfstreet@gmail.com
การนำเสนอที่เกี่ยวข้อง
คำจำกัดสิทธิ์ความรับผิดชอบ
ข้อมูลและบทความไม่ได้มีวัตถุประสงค์เพื่อก่อให้เกิดกิจกรรมทางการเงิน, การลงทุน, การซื้อขาย, ข้อเสนอแนะ หรือคำแนะนำประเภทอื่น ๆ ที่ให้หรือรับรองโดย TradingView อ่านเพิ่มเติมใน ข้อกำหนดการใช้งาน