
Bitcoin Cash (BCH) technical analysis:
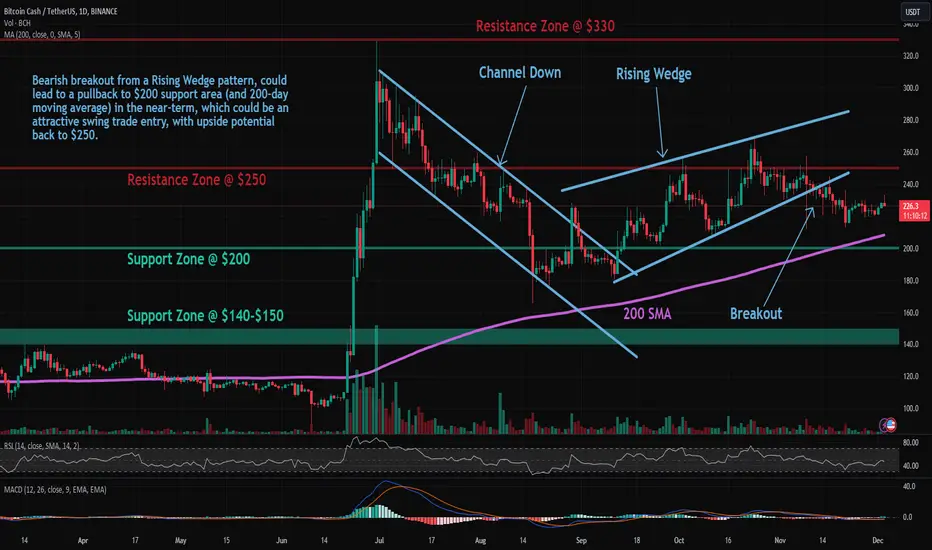
Trade setup: Bearish breakout from a Rising Wedge pattern, could lead to a pullback to $200 support area (and 200-day moving average) in the near-term, which could be an attractive swing trade entry, with upside potential back to $250.
Pattern: Rising Wedge It usually forms after an uptrend and suggests a potential bearish reversal in the original uptrend. When price breaks the lower trend line the price is expected to trend lower.
Trend: Neutral on Medium-Term basis and Uptrend on Short- and Long-Term basis.
Momentum is Mixed as MACD Line is above MACD Signal Line (Bullish) but RSI ~ 50 (Neutral).
Support and Resistance: Nearest Support Zone is $200 (previous resistance), then $140 – $150. The nearest Resistance Zone is $250, then $330.
Trade setup: Bearish breakout from a Rising Wedge pattern, could lead to a pullback to $200 support area (and 200-day moving average) in the near-term, which could be an attractive swing trade entry, with upside potential back to $250.
Pattern: Rising Wedge It usually forms after an uptrend and suggests a potential bearish reversal in the original uptrend. When price breaks the lower trend line the price is expected to trend lower.
Trend: Neutral on Medium-Term basis and Uptrend on Short- and Long-Term basis.
Momentum is Mixed as MACD Line is above MACD Signal Line (Bullish) but RSI ~ 50 (Neutral).
Support and Resistance: Nearest Support Zone is $200 (previous resistance), then $140 – $150. The nearest Resistance Zone is $250, then $330.

คำจำกัดสิทธิ์ความรับผิดชอบ
ข้อมูลและบทความไม่ได้มีวัตถุประสงค์เพื่อก่อให้เกิดกิจกรรมทางการเงิน, การลงทุน, การซื้อขาย, ข้อเสนอแนะ หรือคำแนะนำประเภทอื่น ๆ ที่ให้หรือรับรองโดย TradingView อ่านเพิ่มเติมใน ข้อกำหนดการใช้งาน
คำจำกัดสิทธิ์ความรับผิดชอบ
ข้อมูลและบทความไม่ได้มีวัตถุประสงค์เพื่อก่อให้เกิดกิจกรรมทางการเงิน, การลงทุน, การซื้อขาย, ข้อเสนอแนะ หรือคำแนะนำประเภทอื่น ๆ ที่ให้หรือรับรองโดย TradingView อ่านเพิ่มเติมใน ข้อกำหนดการใช้งาน