
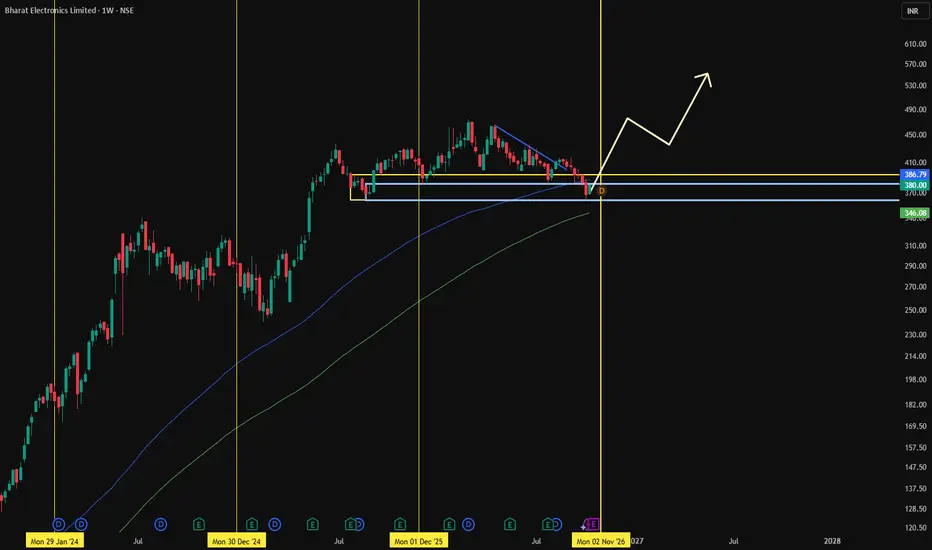
BEL — Detailed HTF + MTF + ITF Demand-Zone Analysis
BEL model shows an UP trend across all timeframes, with the strongest near-term demand confluence between ₹358 and ₹371. The higher-timeframe demand zone is much wider at ₹238–₹337, while monthly and weekly demand sit higher at ₹373–₹397.
1. HTF — Higher-timeframe demand zones
Yearly demand
UP
₹238–₹337
Proximal ₹337 · Distal ₹238 · Average ₹288
Logic: Rally–Base–Rally
This is the broad strategic demand zone in your model. A pullback into this area would be a much deeper correction than the current MTF setup. The zone's width means it should not be treated as a single precise entry price.
Half-yearly demand
UP
₹238–₹337
Proximal ₹337 · Distal ₹238 · Average ₹288
Logic: Rally–Base–Rally
It exactly matches the yearly zone in your data. This alignment is consistent with a shared higher-timeframe demand reference, although the two labels do not independently prove buying activity.
Quarterly demand
UP
₹238–₹337
Proximal ₹337 · Distal ₹238 · Average ₹288
Logic: Rally–Base–Rally
The quarterly zone also matches the yearly and half-yearly zones. Your HTF average therefore remains ₹288, with the combined boundary at ₹337 on top and ₹238 below.
HTF interpretation: All three zones overlap completely. This provides a consistent strategic reference, but your model does not show whether price has recently revisited the zone or whether the original demand remains fresh.
2. MTF — Monthly, weekly and daily demand
Monthly demand
UP
₹373–₹393
Proximal ₹393 · Distal ₹373 · Average ₹383
Logic: BUFL
This is the upper MTF demand zone in your table. A pullback into ₹373–₹393 followed by a bullish reaction could support a continuation setup.
Weekly demand
UP
₹358–₹397
Proximal ₹397 · Distal ₹358 · Average ₹378
Logic: BUFL
The weekly zone overlaps the entire monthly zone. This creates a broader shared demand area between ₹373 and ₹393, with the weekly zone extending above to ₹397 and below to ₹358.
Daily demand
UP
₹358–₹371
Proximal ₹371 · Distal ₹358 · Average ₹365
Logic: BUFL, with DMIP noted in your analysis label
This is the lower tactical demand zone. It aligns with the lower boundary of weekly demand and with the 240-minute and 180-minute zones.
Key MTF demand levels
Price area Interpretation
₹393–₹397 Upper monthly/weekly demand boundary
₹373–₹393 Shared monthly/weekly demand
₹371–₹373 Transition between daily and monthly zones
₹358–₹371 Daily demand and intraday confluence
Below ₹358 Proposed stop-loss boundary breached
The ₹358–₹397 weekly zone is the broadest near-term demand area in your model. The most concentrated lower-timeframe support sits at ₹358–₹371.
3. ITF — Intraday demand zones
Timeframe Proximal Distal Average
240-minute ₹371 ₹358 ₹365
180-minute ₹371 ₹358 ₹365
60-minute ₹364 ₹363 ₹364
ITF average ₹369 ₹360 ₹364
The 240-minute and 180-minute zones match exactly at ₹358–₹371. The 60-minute zone is much narrower, at ₹363–₹364.
This creates a potential intraday confluence around ₹363–₹364. However, the 60-minute zone is only ₹1 wide, so its usefulness depends on the accuracy of the underlying chart levels and the price's actual reaction there.
For confirmation, look for a liquidity sweep, bullish break of structure, strong close back above demand and a successful retest. The table alone cannot establish institutional accumulation.
4. Combined demand map
BEL demand hierarchy
Ordered by price; the bars are illustrative and do not represent probability.
Monthly / weekly upper boundary
₹393–₹397
Monthly / weekly overlap
₹373–₹393
Daily / 240m / 180m
₹358–₹371
60-minute micro-demand
₹363–₹364
HTF strategic demand
₹238–₹337
5. Trade setup linked to demand
Proposed MTF trade
Conditional bullish setup
Entry 1
₹393
Entry 2
₹371
Average entry
₹382
Stop-loss
₹358
Target
₹488
Gross RR
4.42:1
Assumes 10,000 shares, split equally between the two entries, with both orders filled at the specified prices.
Your planned entry at ₹393 is at the monthly zone's proximal boundary. Entry at ₹371 is at the upper boundary of daily and intraday demand. The ₹358 stop-loss matches the distal boundary of the weekly, daily, 240-minute and 180-minute zones.
One important issue: your last high is ₹464, which is below the target of ₹488. The target therefore requires a breakout above the prior high, not merely a bounce within demand. Consider ₹464 a key resistance and confirmation level.
6. Calculation checks
- Gross purchase value: ₹38,20,000 — correct for 10,000 shares at ₹382.
- Gross risk: ₹2,40,000 — correct for a ₹24 stop distance.
- Gross reward: ₹10,60,000 — correct for a ₹106 target distance.
- Gross RR: \(106/24 = 4.42:1\) — correct.
- Stated brokerage and taxes: ₹18,725 — approximately 0.49% of purchase value, but confirm whether it includes both buy and sell turnover.
- Estimated interest: ₹73,017 — consistent with approximately four months of financing on ₹22,92,000 at 9.69% annual interest, subject to the actual day-count and outstanding balance.
- Total net profit of ₹9,68,258 — arithmetically matches the supplied deductions, but actual transaction costs may be higher if the 0.49% does not cover both sides.
Final view: BEL's supplied model has complete HTF zone alignment and strong MTF/ITF confluence near ₹358–₹371. The setup is structurally bullish according to your labels, but entry confirmation and a breakout above ₹464 are important before treating ₹488 as an achievable target.
BEL model shows an UP trend across all timeframes, with the strongest near-term demand confluence between ₹358 and ₹371. The higher-timeframe demand zone is much wider at ₹238–₹337, while monthly and weekly demand sit higher at ₹373–₹397.
1. HTF — Higher-timeframe demand zones
Yearly demand
UP
₹238–₹337
Proximal ₹337 · Distal ₹238 · Average ₹288
Logic: Rally–Base–Rally
This is the broad strategic demand zone in your model. A pullback into this area would be a much deeper correction than the current MTF setup. The zone's width means it should not be treated as a single precise entry price.
Half-yearly demand
UP
₹238–₹337
Proximal ₹337 · Distal ₹238 · Average ₹288
Logic: Rally–Base–Rally
It exactly matches the yearly zone in your data. This alignment is consistent with a shared higher-timeframe demand reference, although the two labels do not independently prove buying activity.
Quarterly demand
UP
₹238–₹337
Proximal ₹337 · Distal ₹238 · Average ₹288
Logic: Rally–Base–Rally
The quarterly zone also matches the yearly and half-yearly zones. Your HTF average therefore remains ₹288, with the combined boundary at ₹337 on top and ₹238 below.
HTF interpretation: All three zones overlap completely. This provides a consistent strategic reference, but your model does not show whether price has recently revisited the zone or whether the original demand remains fresh.
2. MTF — Monthly, weekly and daily demand
Monthly demand
UP
₹373–₹393
Proximal ₹393 · Distal ₹373 · Average ₹383
Logic: BUFL
This is the upper MTF demand zone in your table. A pullback into ₹373–₹393 followed by a bullish reaction could support a continuation setup.
Weekly demand
UP
₹358–₹397
Proximal ₹397 · Distal ₹358 · Average ₹378
Logic: BUFL
The weekly zone overlaps the entire monthly zone. This creates a broader shared demand area between ₹373 and ₹393, with the weekly zone extending above to ₹397 and below to ₹358.
Daily demand
UP
₹358–₹371
Proximal ₹371 · Distal ₹358 · Average ₹365
Logic: BUFL, with DMIP noted in your analysis label
This is the lower tactical demand zone. It aligns with the lower boundary of weekly demand and with the 240-minute and 180-minute zones.
Key MTF demand levels
Price area Interpretation
₹393–₹397 Upper monthly/weekly demand boundary
₹373–₹393 Shared monthly/weekly demand
₹371–₹373 Transition between daily and monthly zones
₹358–₹371 Daily demand and intraday confluence
Below ₹358 Proposed stop-loss boundary breached
The ₹358–₹397 weekly zone is the broadest near-term demand area in your model. The most concentrated lower-timeframe support sits at ₹358–₹371.
3. ITF — Intraday demand zones
Timeframe Proximal Distal Average
240-minute ₹371 ₹358 ₹365
180-minute ₹371 ₹358 ₹365
60-minute ₹364 ₹363 ₹364
ITF average ₹369 ₹360 ₹364
The 240-minute and 180-minute zones match exactly at ₹358–₹371. The 60-minute zone is much narrower, at ₹363–₹364.
This creates a potential intraday confluence around ₹363–₹364. However, the 60-minute zone is only ₹1 wide, so its usefulness depends on the accuracy of the underlying chart levels and the price's actual reaction there.
For confirmation, look for a liquidity sweep, bullish break of structure, strong close back above demand and a successful retest. The table alone cannot establish institutional accumulation.
4. Combined demand map
BEL demand hierarchy
Ordered by price; the bars are illustrative and do not represent probability.
Monthly / weekly upper boundary
₹393–₹397
Monthly / weekly overlap
₹373–₹393
Daily / 240m / 180m
₹358–₹371
60-minute micro-demand
₹363–₹364
HTF strategic demand
₹238–₹337
5. Trade setup linked to demand
Proposed MTF trade
Conditional bullish setup
Entry 1
₹393
Entry 2
₹371
Average entry
₹382
Stop-loss
₹358
Target
₹488
Gross RR
4.42:1
Assumes 10,000 shares, split equally between the two entries, with both orders filled at the specified prices.
Your planned entry at ₹393 is at the monthly zone's proximal boundary. Entry at ₹371 is at the upper boundary of daily and intraday demand. The ₹358 stop-loss matches the distal boundary of the weekly, daily, 240-minute and 180-minute zones.
One important issue: your last high is ₹464, which is below the target of ₹488. The target therefore requires a breakout above the prior high, not merely a bounce within demand. Consider ₹464 a key resistance and confirmation level.
6. Calculation checks
- Gross purchase value: ₹38,20,000 — correct for 10,000 shares at ₹382.
- Gross risk: ₹2,40,000 — correct for a ₹24 stop distance.
- Gross reward: ₹10,60,000 — correct for a ₹106 target distance.
- Gross RR: \(106/24 = 4.42:1\) — correct.
- Stated brokerage and taxes: ₹18,725 — approximately 0.49% of purchase value, but confirm whether it includes both buy and sell turnover.
- Estimated interest: ₹73,017 — consistent with approximately four months of financing on ₹22,92,000 at 9.69% annual interest, subject to the actual day-count and outstanding balance.
- Total net profit of ₹9,68,258 — arithmetically matches the supplied deductions, but actual transaction costs may be higher if the 0.49% does not cover both sides.
Final view: BEL's supplied model has complete HTF zone alignment and strong MTF/ITF confluence near ₹358–₹371. The setup is structurally bullish according to your labels, but entry confirmation and a breakout above ₹464 are important before treating ₹488 as an achievable target.

คำจำกัดสิทธิ์ความรับผิดชอบ
ข้อมูลและบทความไม่ได้มีวัตถุประสงค์เพื่อก่อให้เกิดกิจกรรมทางการเงิน, การลงทุน, การซื้อขาย, ข้อเสนอแนะ หรือคำแนะนำประเภทอื่น ๆ ที่ให้หรือรับรองโดย TradingView อ่านเพิ่มเติมใน ข้อกำหนดการใช้งาน
คำจำกัดสิทธิ์ความรับผิดชอบ
ข้อมูลและบทความไม่ได้มีวัตถุประสงค์เพื่อก่อให้เกิดกิจกรรมทางการเงิน, การลงทุน, การซื้อขาย, ข้อเสนอแนะ หรือคำแนะนำประเภทอื่น ๆ ที่ให้หรือรับรองโดย TradingView อ่านเพิ่มเติมใน ข้อกำหนดการใช้งาน