
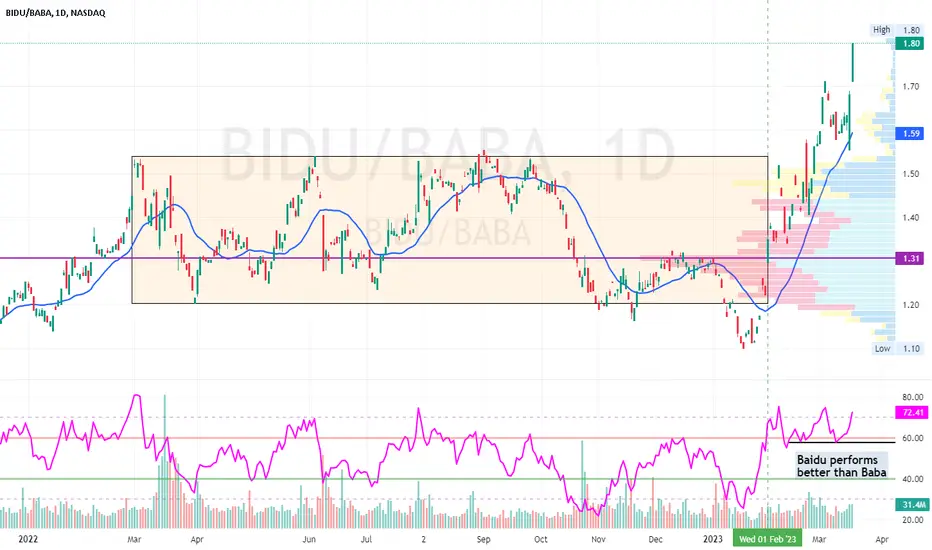
One year Daily Chart
a simple comparison by dividing #BIDU / #BABA
The ratio has been kept mostly within 1.20 ~ 1.5+
Daily RSI starts to surpass 60, which potentially starts a bullish move
*** in this case, meaning Baidu will potentially starts to outperform Baba for quite sometime)
The ratio finally surpass 1.50+ again and has since mark a new High
RSI continues to stays along high levels
so long RSI did not break below leveled support, Baidu will perform better than Baba
a simple comparison by dividing #BIDU / #BABA
The ratio has been kept mostly within 1.20 ~ 1.5+
Daily RSI starts to surpass 60, which potentially starts a bullish move
*** in this case, meaning Baidu will potentially starts to outperform Baba for quite sometime)
The ratio finally surpass 1.50+ again and has since mark a new High
RSI continues to stays along high levels
so long RSI did not break below leveled support, Baidu will perform better than Baba
บันทึก
a total reversal! now Baba is better, ratio may gradualy drop back along 1.2 area
คำจำกัดสิทธิ์ความรับผิดชอบ
ข้อมูลและบทความไม่ได้มีวัตถุประสงค์เพื่อก่อให้เกิดกิจกรรมทางการเงิน, การลงทุน, การซื้อขาย, ข้อเสนอแนะ หรือคำแนะนำประเภทอื่น ๆ ที่ให้หรือรับรองโดย TradingView อ่านเพิ่มเติมใน ข้อกำหนดการใช้งาน
คำจำกัดสิทธิ์ความรับผิดชอบ
ข้อมูลและบทความไม่ได้มีวัตถุประสงค์เพื่อก่อให้เกิดกิจกรรมทางการเงิน, การลงทุน, การซื้อขาย, ข้อเสนอแนะ หรือคำแนะนำประเภทอื่น ๆ ที่ให้หรือรับรองโดย TradingView อ่านเพิ่มเติมใน ข้อกำหนดการใช้งาน