ที่อัปเดต:
BLZBTC H&D Pattern.
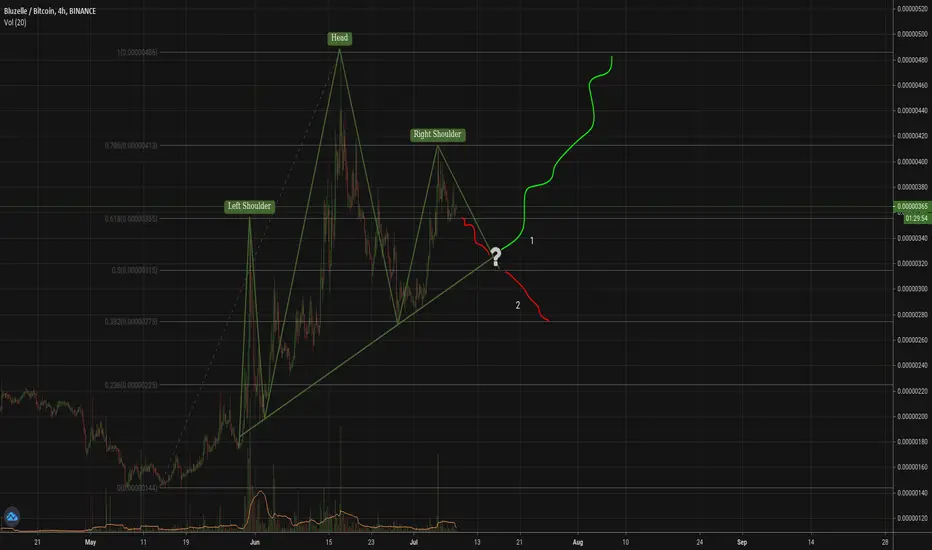
So, basically that's kind of valid H&D pattern that occurred on 4h chart. That kind of H&D pattern is usually followed up by price decline, and in order to somehow predict approximate support price level, I used Fibonacci levels. According to Fibonacci levels, price can drop to 0.386 level, which is ~= 280 satoshis.
On the other hand, if we look at scenario 1, it can happen if price stays above Fibonacci 0.5 level, and price will continue it's upward movement.
In any case, price should rise gradually, as if one looks at 1D-1W price chart, BLZBTC has broken falling wedge/channel recently with high volume spike and price increase.
I will only invest in it, if price stays above 0.5 level. Good luck with your trades !
https://excellenceassured.com/wp-content/uploads/2017/04/Head-Shoulders-Chart-Patterns-on-the-DAX-April-2017.png
การซื้อขายยังคงดำเนินอยู่
H&D failed, going to scenario 1
คำจำกัดสิทธิ์ความรับผิดชอบ
ข้อมูลและบทความไม่ได้มีวัตถุประสงค์เพื่อก่อให้เกิดกิจกรรมทางการเงิน, การลงทุน, การซื้อขาย, ข้อเสนอแนะ หรือคำแนะนำประเภทอื่น ๆ ที่ให้หรือรับรองโดย TradingView อ่านเพิ่มเติมใน ข้อกำหนดการใช้งาน
คำจำกัดสิทธิ์ความรับผิดชอบ
ข้อมูลและบทความไม่ได้มีวัตถุประสงค์เพื่อก่อให้เกิดกิจกรรมทางการเงิน, การลงทุน, การซื้อขาย, ข้อเสนอแนะ หรือคำแนะนำประเภทอื่น ๆ ที่ให้หรือรับรองโดย TradingView อ่านเพิ่มเติมใน ข้อกำหนดการใช้งาน