
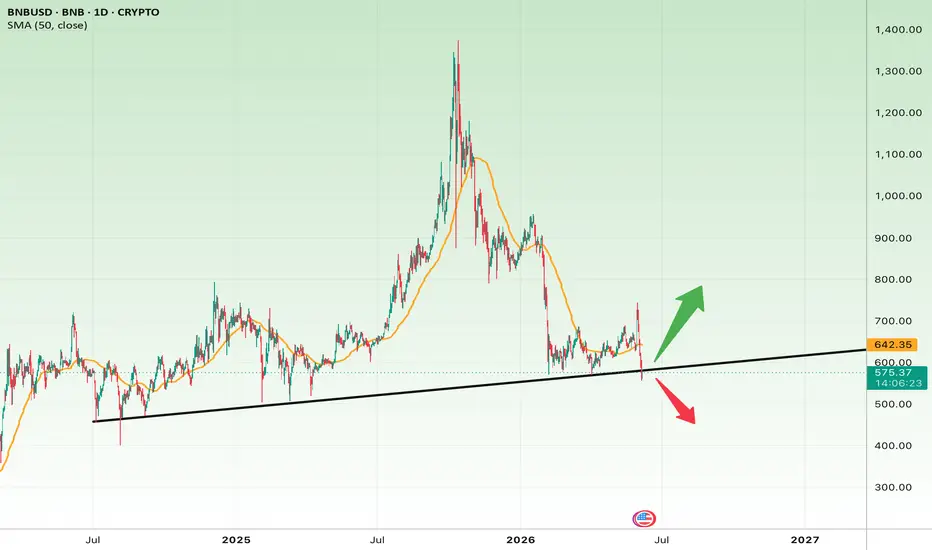
Based on the daily chart you shared, BNB is currently testing a major long-term ascending trendline that has acted as support for years. Price is trading around $581, while the 50-day SMA is near $642, meaning the market is still below an important short-term trend indicator.
Short-Term Analysis
BNB is sitting in a key decision zone.
Bullish Scenario
The long-term trendline remains intact, and buyers appear to be defending the support area. If price can reclaim and hold above $600, followed by a breakout above the $640–650 resistance zone, bullish momentum could accelerate.
Targets:
Target 1: $640
Target 2: $700
Target 3: $760–780
Stop Loss:
Daily close below $560
Bearish Scenario
A confirmed breakdown below the ascending trendline and a daily close under $560 would weaken the bullish structure and likely trigger further selling pressure.
Downside Targets:
$520
$480
$430
Bearish Invalidation (Stop Loss for Shorts):
Daily close back above $610
Medium- to Long-Term Analysis
From a broader perspective, BNB's multi-year uptrend is still technically intact. The trendline shown on the chart has been respected multiple times in the past, making the current test highly significant.
As long as this support remains valid, the recent decline can be viewed as a correction within a larger bullish structure rather than a full trend reversal.
Long-Term Bullish Scenario
If the support holds and BNB successfully breaks above $700, the market could enter a stronger recovery phase.
Long-Term Targets:
$800
$950
$1,100
In a strong bull market, a retest of the previous all-time high near $1,300
Investment Stop Loss:
Weekly close below $540
Long-Term Bearish Scenario
If the multi-year trendline is decisively broken, the long-term bullish structure would be damaged and deeper downside becomes likely.
Bearish Targets:
$500
$450
$380
$320
Professional Summary
The $560–600 zone is currently the most important area on the chart. As long as BNB holds above the long-term ascending trendline, the probability favors a move toward $640 and potentially $700+. However, a confirmed breakdown below $560 would significantly increase the risk of a deeper correction.
From a risk-to-reward perspective, long positions near the current support area can be attractive only if strict risk management is applied, with a stop below the support zone. If the trendline holds, the upside potential toward $700–800 offers a favorable reward relative to the risk.
Short-Term Analysis
BNB is sitting in a key decision zone.
Bullish Scenario
The long-term trendline remains intact, and buyers appear to be defending the support area. If price can reclaim and hold above $600, followed by a breakout above the $640–650 resistance zone, bullish momentum could accelerate.
Targets:
Target 1: $640
Target 2: $700
Target 3: $760–780
Stop Loss:
Daily close below $560
Bearish Scenario
A confirmed breakdown below the ascending trendline and a daily close under $560 would weaken the bullish structure and likely trigger further selling pressure.
Downside Targets:
$520
$480
$430
Bearish Invalidation (Stop Loss for Shorts):
Daily close back above $610
Medium- to Long-Term Analysis
From a broader perspective, BNB's multi-year uptrend is still technically intact. The trendline shown on the chart has been respected multiple times in the past, making the current test highly significant.
As long as this support remains valid, the recent decline can be viewed as a correction within a larger bullish structure rather than a full trend reversal.
Long-Term Bullish Scenario
If the support holds and BNB successfully breaks above $700, the market could enter a stronger recovery phase.
Long-Term Targets:
$800
$950
$1,100
In a strong bull market, a retest of the previous all-time high near $1,300
Investment Stop Loss:
Weekly close below $540
Long-Term Bearish Scenario
If the multi-year trendline is decisively broken, the long-term bullish structure would be damaged and deeper downside becomes likely.
Bearish Targets:
$500
$450
$380
$320
Professional Summary
The $560–600 zone is currently the most important area on the chart. As long as BNB holds above the long-term ascending trendline, the probability favors a move toward $640 and potentially $700+. However, a confirmed breakdown below $560 would significantly increase the risk of a deeper correction.
From a risk-to-reward perspective, long positions near the current support area can be attractive only if strict risk management is applied, with a stop below the support zone. If the trendline holds, the upside potential toward $700–800 offers a favorable reward relative to the risk.

คำจำกัดสิทธิ์ความรับผิดชอบ
ข้อมูลและบทความไม่ได้มีวัตถุประสงค์เพื่อก่อให้เกิดกิจกรรมทางการเงิน, การลงทุน, การซื้อขาย, ข้อเสนอแนะ หรือคำแนะนำประเภทอื่น ๆ ที่ให้หรือรับรองโดย TradingView อ่านเพิ่มเติมใน ข้อกำหนดการใช้งาน
คำจำกัดสิทธิ์ความรับผิดชอบ
ข้อมูลและบทความไม่ได้มีวัตถุประสงค์เพื่อก่อให้เกิดกิจกรรมทางการเงิน, การลงทุน, การซื้อขาย, ข้อเสนอแนะ หรือคำแนะนำประเภทอื่น ๆ ที่ให้หรือรับรองโดย TradingView อ่านเพิ่มเติมใน ข้อกำหนดการใช้งาน