
📊🔥 BNB/USDT 4H – Smart Money Setup & Bullish Continuation Zone 🚀
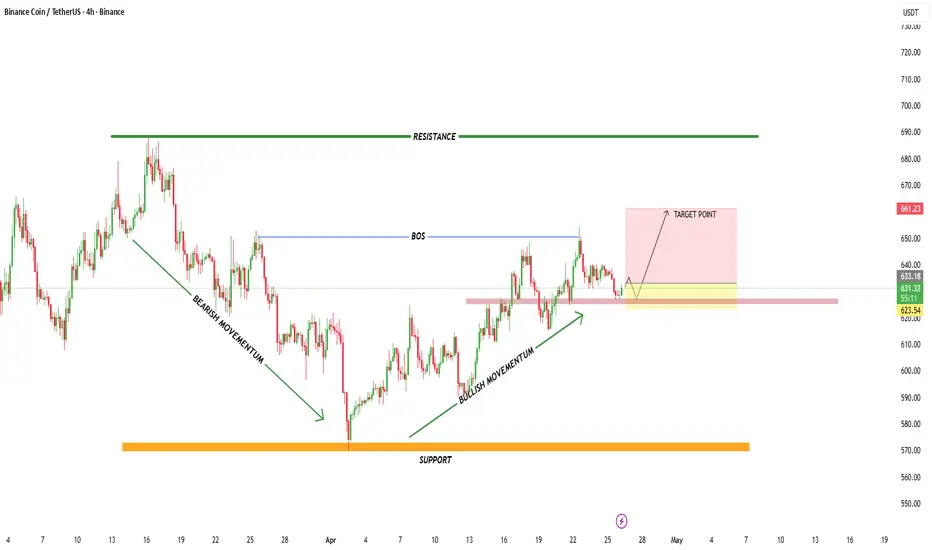
This chart presents a clean market structure transition from bearish to bullish, with a high-probability continuation setup forming. Here’s the professional breakdown:
🧠 Market Structure Insight
The market initially showed strong bearish momentum 📉, forming lower highs and lower lows.
Price reached a major support zone (~570) 🟧, where buyers stepped in aggressively.
A clear shift in structure (BOS – Break of Structure) 🔵 confirms bullish intent after breaking previous resistance.
📈 Current Price Behavior
Price is now consolidating above the BOS level, indicating strength.
We see a bullish retracement into a demand zone (yellow box) — this is a classic buy-on-dip opportunity.
The zone aligns with previous resistance turned support, adding confluence.
🎯 Trade Setup
Entry Zone: 623 – 630 (Demand + Support Flip) 🟨
Stop Loss: Below 620 (structure invalidation) ❌
Target: 660 – 665 (next resistance / supply zone) 🎯
⚡ Momentum & Bias
Short-term: Bullish 🟢
Structure: Higher highs & higher lows forming
Confirmation: Holding above BOS is key
🚨 Key Levels to Watch
🔴 Resistance: ~690 (major supply zone)
🔵 BOS Level: ~645
🟧 Support: ~570 (strong base)
🧩 Conclusion
If price respects the demand zone and holds above support, expect a continuation toward the target zone 📈. A breakdown below support would invalidate the bullish setup.
This chart presents a clean market structure transition from bearish to bullish, with a high-probability continuation setup forming. Here’s the professional breakdown:
🧠 Market Structure Insight
The market initially showed strong bearish momentum 📉, forming lower highs and lower lows.
Price reached a major support zone (~570) 🟧, where buyers stepped in aggressively.
A clear shift in structure (BOS – Break of Structure) 🔵 confirms bullish intent after breaking previous resistance.
📈 Current Price Behavior
Price is now consolidating above the BOS level, indicating strength.
We see a bullish retracement into a demand zone (yellow box) — this is a classic buy-on-dip opportunity.
The zone aligns with previous resistance turned support, adding confluence.
🎯 Trade Setup
Entry Zone: 623 – 630 (Demand + Support Flip) 🟨
Stop Loss: Below 620 (structure invalidation) ❌
Target: 660 – 665 (next resistance / supply zone) 🎯
⚡ Momentum & Bias
Short-term: Bullish 🟢
Structure: Higher highs & higher lows forming
Confirmation: Holding above BOS is key
🚨 Key Levels to Watch
🔴 Resistance: ~690 (major supply zone)
🔵 BOS Level: ~645
🟧 Support: ~570 (strong base)
🧩 Conclusion
If price respects the demand zone and holds above support, expect a continuation toward the target zone 📈. A breakdown below support would invalidate the bullish setup.

✦ MARKET STRATEGY SIGNALS ✦ 📊
Smart Money • Price Action • Precision • good entries
📲 Join Telegram: t.me/marketstrategyentry
Smart Money • Price Action • Precision • good entries
📲 Join Telegram: t.me/marketstrategyentry
การนำเสนอที่เกี่ยวข้อง
คำจำกัดสิทธิ์ความรับผิดชอบ
ข้อมูลและบทความไม่ได้มีวัตถุประสงค์เพื่อก่อให้เกิดกิจกรรมทางการเงิน, การลงทุน, การซื้อขาย, ข้อเสนอแนะ หรือคำแนะนำประเภทอื่น ๆ ที่ให้หรือรับรองโดย TradingView อ่านเพิ่มเติมใน ข้อกำหนดการใช้งาน
✦ MARKET STRATEGY SIGNALS ✦ 📊
Smart Money • Price Action • Precision • good entries
📲 Join Telegram: t.me/marketstrategyentry
Smart Money • Price Action • Precision • good entries
📲 Join Telegram: t.me/marketstrategyentry
การนำเสนอที่เกี่ยวข้อง
คำจำกัดสิทธิ์ความรับผิดชอบ
ข้อมูลและบทความไม่ได้มีวัตถุประสงค์เพื่อก่อให้เกิดกิจกรรมทางการเงิน, การลงทุน, การซื้อขาย, ข้อเสนอแนะ หรือคำแนะนำประเภทอื่น ๆ ที่ให้หรือรับรองโดย TradingView อ่านเพิ่มเติมใน ข้อกำหนดการใช้งาน