
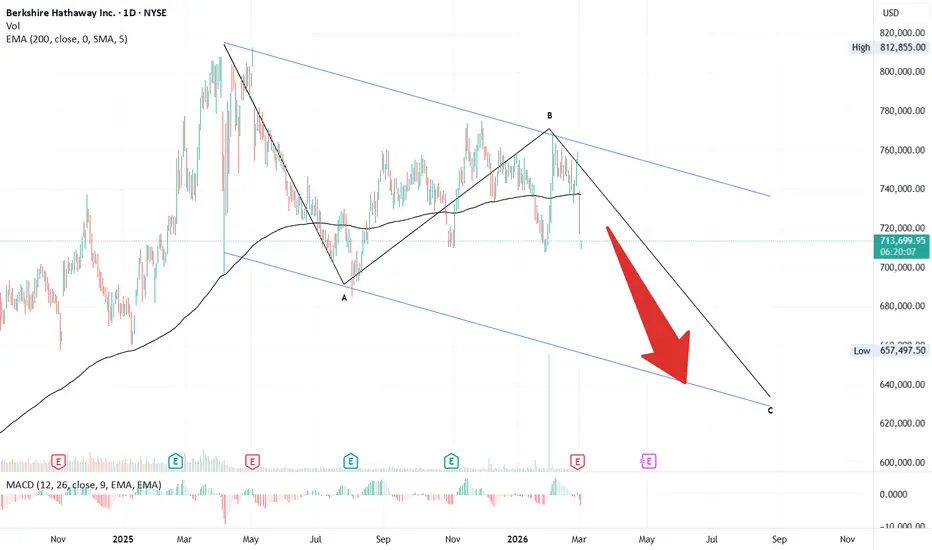
📊 Berkshire Hathaway: Elliott Wave View
🕰️ Context
Since May 2025, Berkshire Hathaway entered a correction. The drop to 682k completed Wave A in five sub-waves — classic Zigzag setup.
🔎 Structure
• 📉 Wave A: Low at 682k
• 🔄 Wave B: Retraced near 61.8% Fibonacci
• 📉 Wave C: Projection toward 640k → ~15% downside
📊 Implications
• 📐 Zigzag retracements often hit 50–61.8%
• ⚠️ Risk: A move to 640k is significant
• 🔀 Alternatives:• ✅ Hold above 682k → correction may end
• ❌ Break below 640k → complex correction likely
🧭 Conclusion
Berkshire’s correction looks unfinished, with 640k as a key target. Watch 682k and 640k for signals of completion or deeper structure.

การนำเสนอที่เกี่ยวข้อง
คำจำกัดสิทธิ์ความรับผิดชอบ
ข้อมูลและบทความไม่ได้มีวัตถุประสงค์เพื่อก่อให้เกิดกิจกรรมทางการเงิน, การลงทุน, การซื้อขาย, ข้อเสนอแนะ หรือคำแนะนำประเภทอื่น ๆ ที่ให้หรือรับรองโดย TradingView อ่านเพิ่มเติมใน ข้อกำหนดการใช้งาน
การนำเสนอที่เกี่ยวข้อง
คำจำกัดสิทธิ์ความรับผิดชอบ
ข้อมูลและบทความไม่ได้มีวัตถุประสงค์เพื่อก่อให้เกิดกิจกรรมทางการเงิน, การลงทุน, การซื้อขาย, ข้อเสนอแนะ หรือคำแนะนำประเภทอื่น ๆ ที่ให้หรือรับรองโดย TradingView อ่านเพิ่มเติมใน ข้อกำหนดการใช้งาน